System Health Page
Use the System Health page to view the current health status of your Performance Manager system.
The System Health section displays the following information:
| Item | Description |
|---|---|
| MeasureCache size | Number of measures per monitor/location combination that are currently cached in the system's RAM. The displayed hit ratio should eventually reach 100%. If the hit ratio goes down or never reaches 100%, this is an indicator that Performance Manager's caching system does not work as expected. Requesting assistance from customer support is recommended in such a case. |
| MeasureCache measSize | Number of records for raw data that are sent to the database in an SQL batch job. |
| MeasureCache lastSize | Number of records for aggregated data that are sent to the database in an SQL batch job. |
| HealthCache size | Number of project-wide measures that are currently cached in the system's RAM. The displayed hit ratio should eventually reach 100%. If the hit ratio goes down or never reaches 100%, this is an indicator that Performance Manager's caching system does not work as expected. Requesting assistance from customer support is recommended in such a case. |
| MeasureCount SYN | Number of measures that are generated by the system per hour from synthetic monitors. active monitors x measures per monitor x active locations x monitor runs where monitor runs = scheduled executions per hour. |
| MeasureWriteTime (limit) | The maximum time that the system may use to write one measure to the database, based on calculated estimates. See Measures received / written per period for actual numbers. |
| MeasureWriteTime (avg) | The average time that the system actually uses to write one measure to the database. If this value is higher than MeasureWriteTime (limit), the system is overloaded. See also Customizing the Displayed Information on the System Health Page. |
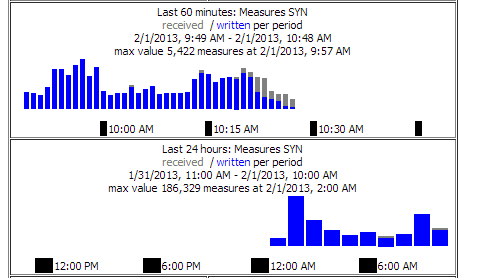
| Measures received / written per period |
The Measures received / written per period graph displays the amount of measures that the application server has received from all execution servers in a specific period of time. The upper graph displays the numbers for each minute over the last 60 minutes, the lower graph the numbers for each hour over the last 24 hours. Received measures are displayed as gray bars, which should ideally turn to blue bars (written measures) at the end of a period, as all received measures have been written to the database. If you see a stacked bar (blue / gray), this indicates that the system was not able to write the full amount of received measures to the database in the specific period. System overload? Stacked bars (blue / gray), which indicate that the system was not able to write the full amount of received
measures to the database in a specific period, do not necessarily mean that your system is not able to handle the load anymore
-- it is possible that during certain background activities (for example database backup, index rebuilds, or data deletion
jobs), the system may be overloaded for some time, while it may very well be able to recover again after such activities have
been completed. Examine the trend in the chart to interpret the load on your system: If gray bars eventually turn blue, this
means that the system was able to catch up again. However if the frequency and duration of gray bars increases over time or
if you observe a constant overload (gray bars), you may want to reduce the volume of measures being written. Ultimately these
only become a concern if the total backlog continues to grow. This graph is intended to give you an early warning of how much
and how frequently you have input exceeding output so you can address it before measure volumes become unmanageable. There
are several suggested ways to reduce the volume of measures including:
Note: The amount of written measures is usually slightly higher than the amount of received measures, as application server-specific
measures (for example overall health and performance) are counted towards the amount of written measures, however they are
not calculated as received measures as they do not come from the execution servers.
|
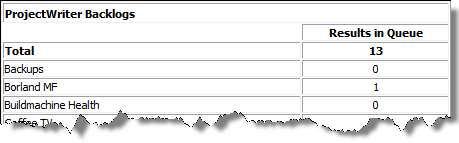
The ProjectWriter Backlogs section displays the number of results in the queue, displayed for each project. These are measures that are delivered by the execution server, but are not yet saved to the database.
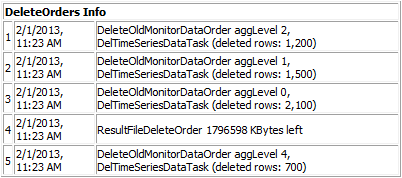
The DeleteOrders Info section is only visible if data storage reduction processes are currently running. It displays the running DataDelete jobs, where each DataDelete job actually creates a job per project plus an additional job for the result files.
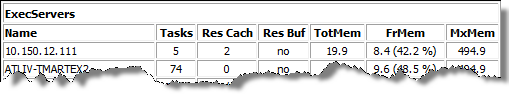
- Tasks: Amount of monitors scheduled on the execution server.
- Res Cach: Amount of results that have not yet been received by the application server. This value should ideally be zero.
- Res Buf: Displays whether persistent result data is enabled or not on the execution server.
- TotMem: Java heap size that is currently allocated.
- FrMem: Java heap size that is still available.
- MxMem: Maximum Java heap size.
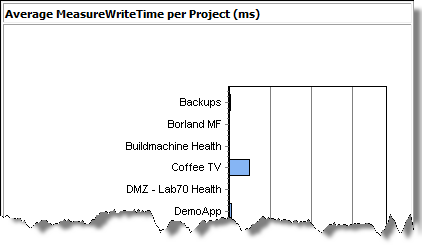
The Average MeasureWriteTime per Project (ms) section displays the average time that the system actually uses to write one measure to the database, for each project.