Tour of the UI
Take some time to acquaint yourself with the TrueLog Explorer interface to make your test-script customization and verification tasks easier to organize and perform.
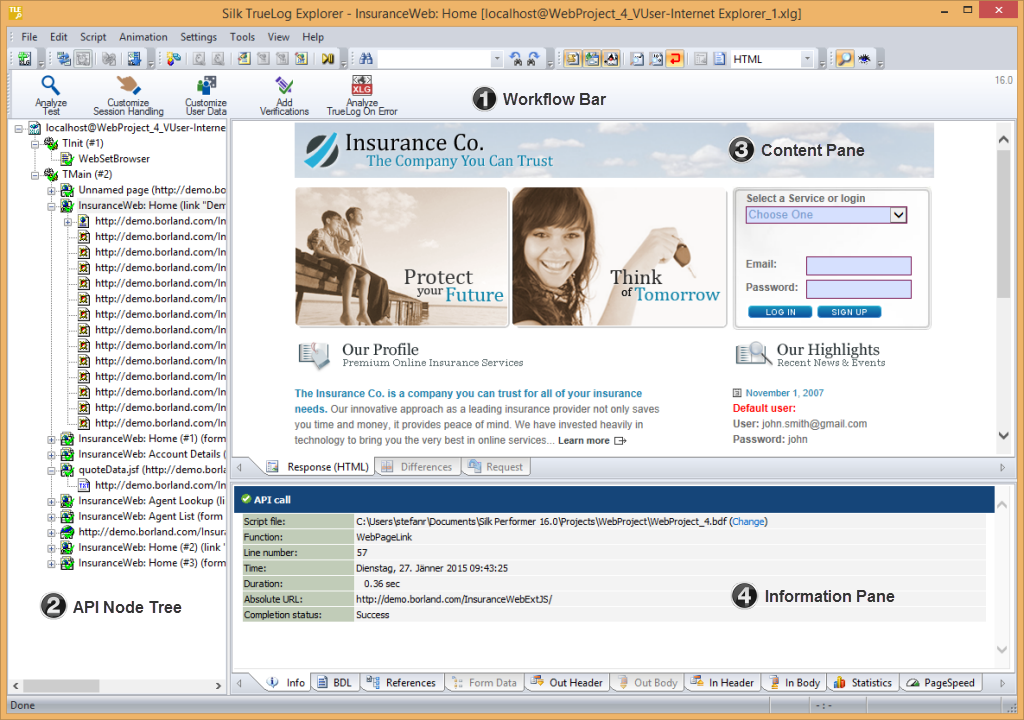
The main sections of the TrueLog Explorer interface are highlighted below.
Main Menu
Toolbar
Workflow Bar
The workflow bar facilitates the primary actions related to analyzing test-run results and customizing scripts. The workflow bar reflects TrueLog Explorer's built-in load-testing methodology by supporting its five primary tasks:
- analyzing test runs
- customizing session handling
- customizing user data
- adding verifications
- analyzing TrueLog On Error
API Node Tree Menu
The menu tree, located on the left side of the interface, allows you to expand and collapse each TrueLog API node. Click a node to display its contents on the Content pane and its history details on the Information pane.
Content Pane
- Response
-
(Web-based applications only)
The Response page displays the visually rendered response from the server. HTML, XML, and JSON can be visually rendered. All other content cannot be rendered and will display in their raw format. In such a case, the tab displays Response (Raw). To change the render mode, right-click the Response tab and select a mode.
- SQL Command
-
(database applications only)
The SQL Command page displays SQL statements associated with the selected database call, including input and result data. It is the same as the Response page for other protocols.
- Differences
-
(Web-based applications only)
The Differences page lists the In Body differences between selected nodes. This page is helpful in finding dynamic information in server responses. It is the first place to look for session information.
Note: The Differences page is only available in difference mode. - Request
-
(Web-based applications only)
The Request page displays out-data (data sent by an application to a server) in a rendered format. With XML, an XML menu tree representation is displayed. With HTML, posted data (either the POST data of a HTTP-POST command or the query string data of a HTTP-GET command) are displayed within the HTML page that includes the HTML form that corresponds to the posted data. Only context-full HTML form data submissions (HTML form data submitted with WebPageSubmit, not submissions via WebPageForm) are displayed on the Request page. Elements are displayed in magenta. Attributes are displayed in cyan.
To search for content in rendered view, right-click in the rendered view and choose Find. The global find option is not able to search rendered view.
Note: Response and Request pages can display content from different API nodes simultaneously. When the Response page is the result of an HTML-FORM submission of a preceding Web page, the Request page displays the Web page that contains the submitted values. These values are visible via mouse-over. - Form Controls
-
(Oracle Forms only)
The Form Controls page displays the properties of Oracle Forms controls (state and content). In compare mode, this page compares the states of controls between record and replay.
- Screen
-
(Citrix only)
The Screen page displays rendered application GUIs, window synchronization functions, and user input values.
- Window
-
(Citrix only)
Displays the window that is referenced by the window parameter of the current function.
- Start Request
-
(SAPGUI only)
The Start Request page displays the state of a SAPGUI application before each server round trip.
- End Request
-
(SAPGUI only)
The End Request page displays the state of a SAPGUI application after each server round trip.
- Host Screen
-
(Terminal-emulation applications only)
The Host Screen page displays the visually rendered response from the server for the selected API node in a terminal view.
Information Pane
The Information pane offers data regarding testing scripts and test runs, including BDL scripting, HTTP headers, and timing statistics. Depending on the type of application under test (Web, XML, database, Oracle Forms, SAPGUI, Citrix, TCP/IP, UDP, or other), the Information pane offers different views.
- Info
-
The Info page displays general information about the open TrueLog file and the selected API node.
- BDL
-
The BDL page displays the BDL script that corresponds to the open TrueLog. The BDL script is automatically positioned to the line of the selected API node.
- References
-
This page is active only for nodes that return HTML data. The References page displays a simple DOM (Document Object Model) of the selected HTML including the elements Hyperlinks, Frames,Embedded documents, and Forms.
- Form Data
-
A convenient tool for viewing and working with all customizable controls that are included on Oracle Forms screens or submitted to Web servers.
- Out Header
-
The Out Header page contains the exact HTTP header that the application (Silk Performer in the case of replay TrueLogs, the browser in the case of record TrueLogs) sends to the server.
- Out Body
-
In the case of HTTP, this page contains data sent with HTTP-POST commands from the application to the server. For TCP/IP and UDP, this page contains data sent with WebTcpipSend functions from the application to the server. For Citrix, this page contains data strings. When using the Oracle Forms log levels of Normal and Debug (this can be set in replay profile settings), the Out Body page contains Oracle Forms messages that are sent for current actions (for example, clicking a button).
You can switch between hexadecimal and textual presentation of data (). By default TrueLog Explorer selects the best representation of data (for example, binary for images, text for HTML documents).
- In Header
-
The In Header page contains the exact HTTP header that the server sends to the application.
- In Body
-
The In Body page contains data received by the application from the server. The data is presented in raw format as it is received from the server (no rendering for HTML, no menu tree representation for XML).
- Statistics
-
For Web applications on protocol-level, the Statistics page shows timing statistics for Web pages. It includes timing information for each Web page component and communication element. It shows exact response times, including the composition for each individual component, in graphical view. This assists you in pinpointing the root causes of errors and slow page downloads. The Statistics page includes the following data for each page component:
- DNS lookup time: The time taken to resolve an IP address from the domain / host name supplied
- Connect time: The time taken for the simulated user to connect to the server
- Time for SSL handshake: The time taken to exchange encryption keys with the server
- Time for sending of data: The time from the first byte of the client request until the last byte of the client request
- Server busy time: Measures the time from the last byte of the client request until the first byte of the server response
- Response receive time: The time from the first byte of the server response until the last byte of the server response, including all docs but not embedded objects
- Cache statistics
- DNS lookup time: The time taken to resolve an IP address from the domain / host name supplied
- Connect time: The time taken for the simulated user to connect to the server
- Net round trip: The time from the first byte of the client request until the last byte of the server response, including all documents but not embedded objects.
- Cache statistics
- Controls
-
The Controls page is a convenient tool for viewing and working with customizable control values that are included within SAPGUI windows.
- Host Screen Info
-
The Host Screen Info page logs additional information for each host screen, including status (a name/value pair). When a field name is selected, the corresponding field in the Host Screen window above is selected. General screen information. For example, cursor position and screen dimensions is also included.