Model Debug Messages
Model debug messages provide detailed information for diagnosing problems such as synchronization with the host and for repairing a malfunctioning model. They provide a review of a model interacting with a terminal datastream, allowing you to diagnose and repair screen recognition, data reads and/or writes, and synchronization flaws in a model. This feature is particularly helpful for those model designers working with VT hosts, where synchronization issues are more common.
A model debug message recording can be used for models under development in the Design Tool and for runtime models that have been deployed to the Host Integrator server.
- You can debug models as you build them in the Design Tool.
-
You can open the model debug messages file created by a runtime server. The naming convention for model debug messages (
.vmr) is based on server startup time, model name or session pool, and session ID. You can customize a.vmrfile name by adding a prefix to the default naming convention. This can simplify testing and working with.vmrfiles. To add a prefix to the.vmrfile name:-
Use the AppConn methods
setVMRFilePrefixandgetVMRFilePrefix. These methods are available for Java and .NET AppConn programs. -
When implemented, a prefix will be added to the default file name (Connection_60.162.vmr) and will look similar to this;
aprefixConnection_60.162.vmr.
-
-
You can export a .vmr file in html or pdf format. Click Export, select the information you want to include and specify where to save the file. Select the extension (pdf, htm, or html) when prompted.
-
File
vmr.css, located inc:/Program Files/Micro Focus/Verastream/HostIntegrator/bin, determines the layout of the html and pdf export files. If desired, modify that file before exporting the .vmr file. -
There is a standalone utility available to view your model debug messages. Using the VMR Viewer you can open, save, and export your model debug messages without having to interact with the Design Tool. The VMR Viewer can be launched from either the Windows Start menu or using the command line option,
Vmrview.exe. To export a .vmr file in pdf format from the command line, use the-dparameter with thevmr.execommand.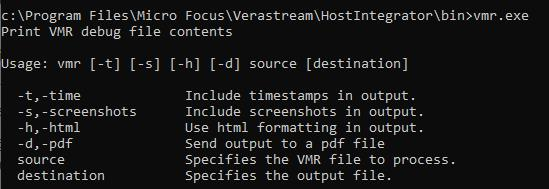
-
Model debug message files (
.vmr) and the session server log files do not contain data written to non-display terminal fields or stored in encrypted model variables. Values that are redacted in.vmrand session server log files are:- Values of variables that are marked encrypt value.
- Encrypted values stored in the model, in operations such as
TransmitToAttrEncryptedandTransmitANSIEncrypted. - Values written to a non-display field (3270/5250).
- Values of attributes that are write-only.
There are rare exceptions where the system cannot determine if a value should be redacted. These can include: logging of model event handlers and callbacks, and specific host applications that may issue commands to read the entire terminal screen.
Warning
It is always important to verify that sensitive data has been removed from model debug message (.vmr) files and session server log files before making them available to others.
You can have up to fifty model debug message recordings open at the same time. This allows you to compare model behavior under different circumstances or after you have made changes to the model.
Configuring model debug message recording mode
Model debug message recording is always enabled for models you open in the Design Tool. When testing your model within the Design Tool, you can configure the message recording level for the test server.
You can record deployed models on the Host Integrator server. You can configure the recording option as you deploy the model.
Model Debug Message Components
VMR Viewer
There is a standalone utility available to view your model debug messages. Using the VMR Viewer you can open, save, and export your model debug messages without having to interact with the Design Tool. The VMR Viewer can be launched from either the Windows Start menu or using the command line option, Vmrview.exe. To export a .vmr file in pdf format from the command line, use the -d parameter with the vmr.exe command.
The model debug messages list
The left hand panel of the Model Debug Messages dialog box shows a list of the messages. The time-based list includes messages that have a subset or a series of nested subsets of additional messages, or descendants, associated with that action. Click the + symbol to view the message subset. These descendants typically display the underlying steps that transpired to produce the top level action.
Click an underlined link in a message to navigate to the entity in question. This option is not available when viewing a saved model debug message (.vmr) file when the model file is not present.
When you're viewing all messages (not datastream messages only), right-click a message for additional options:
- When a + symbol is present, right-click the message to expand the message node.
- Open the Signature Analyzer.
- Create a new entity. If your model navigates to an unexpected host screen, use the New Entity option to capture the information for your model.
- Move to the next error.
- Save a node of the message list as a separate .vmr file. This option is available for root level messages.
Use the following symbols to manipulate the model debug message list:
| Symbol | Meaning |
|---|---|
 |
Display all messages |
 |
Display datastream messages |
 |
Display relative time for descendants |
 |
Find a message |
 |
Find next error |
 |
Clear all messages (Actions that are in progress will not be cleared) |
 |
If you have opened a model debug message file other than the one associated with the current model, click to close the file |
Model debug message details
The right hand panel of the model debug message dialog box shows the details of the message highlighted on the left. Depending on what type of message is selected, it can include one or more of the following:
-
Ending snapshot
A snapshot of the terminal at the time the message was generated. This is particularly helpful if you expect a full screen of data to have been processed, but the action and the associated snapshot shows only a subset of the host screen (with a gray overlay) was actually sent or received. The gray area of the snapshot represents the area of the screen that changed during the course of the action. This kind of feedback makes it much easier to identify where a synchronization issue needs to be handled.
-
Starting and ending snapshots
A navigation message shows both the starting and ending snapshot.
-
Message
When an error or operation message is selected, the message text is repeated in the lower-right panel. This text can be selected and copied to the Clipboard.
-
Procedure data
When a procedure message is selected, the procedure filter parameters and procedure output are displayed. You can use the Copy button to copy the filter parameters or procedure results to the Clipboard.
-
Datastream
When the message is associated with a datastream process, the datastream content displays in a text box in the lower right panel.
-
Event handlers
When a fired event message or event callback message is selected, the input and output of the event or callback is displayed. You can view all messages associated with the runtime model or focus on datastream messages only.
Datastream messages
 Click the datastream messages icon to view datastream messages only in the model debug messages list.
When you select a datastream message (whether you're viewing all model debug messages or just datastream messages), select a message to see datastream details in the window at the lower right of the dialog box.
The datastream window
The datastream window displays the real-time data sent and received from a host. This information is particularly valuable when debugging datastream issues on a character mode host. You can copy and paste text from this window into the WaitForCommString command dialog box or the Host Communication String event dialog box to configure operations that include raw host communications. This window contains errors, and operations in addition to the datastream messages.
Without this window, it is difficult to determine what effect a single key has on the host. With a character mode host, a simple cursor movement can use three packets of 50 or more characters. Lack of knowledge about these internal communications can often lead to missed synchronization points.
In addition, this view allows an easy view of the data that comes from the host, allowing you to choose which data to use for synchronization. Review the information about nonprintable characters , such as control functions, that appear in the Datastream view.
If you select a procedure in the Model Debug Message list, the details in the lower right include a Copy button. You can copy the procedure results to the Clipboard.
Searching datastream content
 When debugging a VT model, use the Suggest Escape Sequence button to have the model debug messages utility suggest a unique escape sequence (if present) that can be used to help synchronize the model. This option is available for VT models only.
You can copy text from this panel to the Clipboard by using the right-click menu or Ctrl+C keystroke. This is useful to paste into a WaitForCommString command (in the Operation Edit dialog box, or in the Host Event Edit dialog box after selecting Host Communication String event) to resolve synchronization issues.
Type a string into the text box at the bottom of the datastream window. All instances of that string in the datastream window are highlighted.
 When debugging a VT model, the Next Packet option lets you move to the next packet using the same search string, simplifying the search process.
 When debugging a VT model, the Previous Packet option lets you move to the previous packet using the same search string, simplifying the search process.
 Use the Next Match button to move to the next occurrence of the string.
 Use the Previous Match button to move to the previous occurrence of the string.
Using Model Messages
On the Debug menu, click Model Debug Messages to open the Model Debug Messages dialog box.
Locating and Solving a Synchronization Problem
If your model does not reach an expected entity or cursor location, review the model debug messages. The example below shows a sequence on a VT host for a PageDown operation.
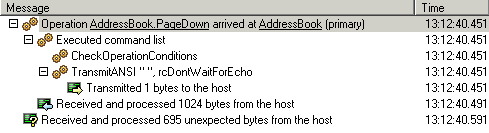
The final message, indicating unexpected bytes received from the host, is a strong indicator of a synchronization problem with the host. By reviewing the messages preceding this message, you can narrow down the source of the problem.
The highlighted message, "Operation AddressBook.PageDown arrived at AddressBook (primary)" has the associated ending snapshot on the lower right:
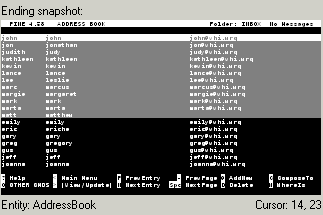
With a PageDown operation, a full screen of data should have been processed, but the action and the associated snapshot shows only a subset of the host screen (with a gray overlay) was actually received.
To ensure that all the expected data is processed before proceeding, you can add a Wait command to the operation.
Note
There may be cases where a synchronization issue does not produce a message that unexpected bytes were received from the host, especially when running on the server. It's a good idea to look for partial operation snapshots similar to the one above whenever the model does not reach an expected entity or cursor location.