Attaching a “C” debugger to a running process
-G
Produces debugging information in the output, allowing C-level debugging.
To perform C-level debugging, use the COBOL-IT Developer Studio.
COBOL-IT translates COBOL to C and uses the host C compiler to compile the translated source. As preparation, compile your COBOL programs with the –G compiler flag. C modules should be compiled for debugging as well.
The –G COBOL compiler flag allows the COBOL program to be include information for the C debugger. This corresponds to the gcc –g compiler flag.
Using the Debug Attach functionality of the Developer Studio to Attach the COBOL Debugger to an Application, you can enter the COBOL Debugger, then start the C debugger, and proceed your debuggeing with both the C and COBOL debuggers running.
The Eclipse IDE for C/C++ Developers, and C compiler are required for this exercise.
-fnostrip
Causes objects and object and executable files to NOT be stripped.
Stripping an object or an executable is the action of removing system level debugging information. The –fno-strip compiler flag is enabled by the –G compiler flag.
Overview
Attaching a C Debugger to an Application is a functionality provided by Eclipse, when the Eclipse IDE for C/C++ Developers plug-in is installed, and the gdb debugger is installed on your system.
As preparation, compile your COBOL programs with the –G compiler flag. The –G COBOL compiler flag allows the COBOL program to be include information for the C debugger. This corresponds to the gcc –g compiler flag. C modules should be compiled for debugging as well.
We will create an executable called newcall, linking a C library compiled for debugging with a COBOL program compiled to allow for C debugging.
We will start our executable from the command-line, use the Debug Attach functionality of the Developer Studio to Attach the COBOL Debugger to the Application.
At that point, we will start the C debugger, and continue with both the COBOL and C debuggers running. We will enter a CALLed C function, and use the C debugger. When finished debugging, we can return to the COBOL program, and resume using the COBOL debugger.
Pre-requisites
The following must be installed on your Linux machine:
- COBOL-IT Compiler Suite Enterprise Edition
- COBOL-IT Developer Studio
- C/C++ Development Tooling
- The gdb source level debugger
Sample Programs
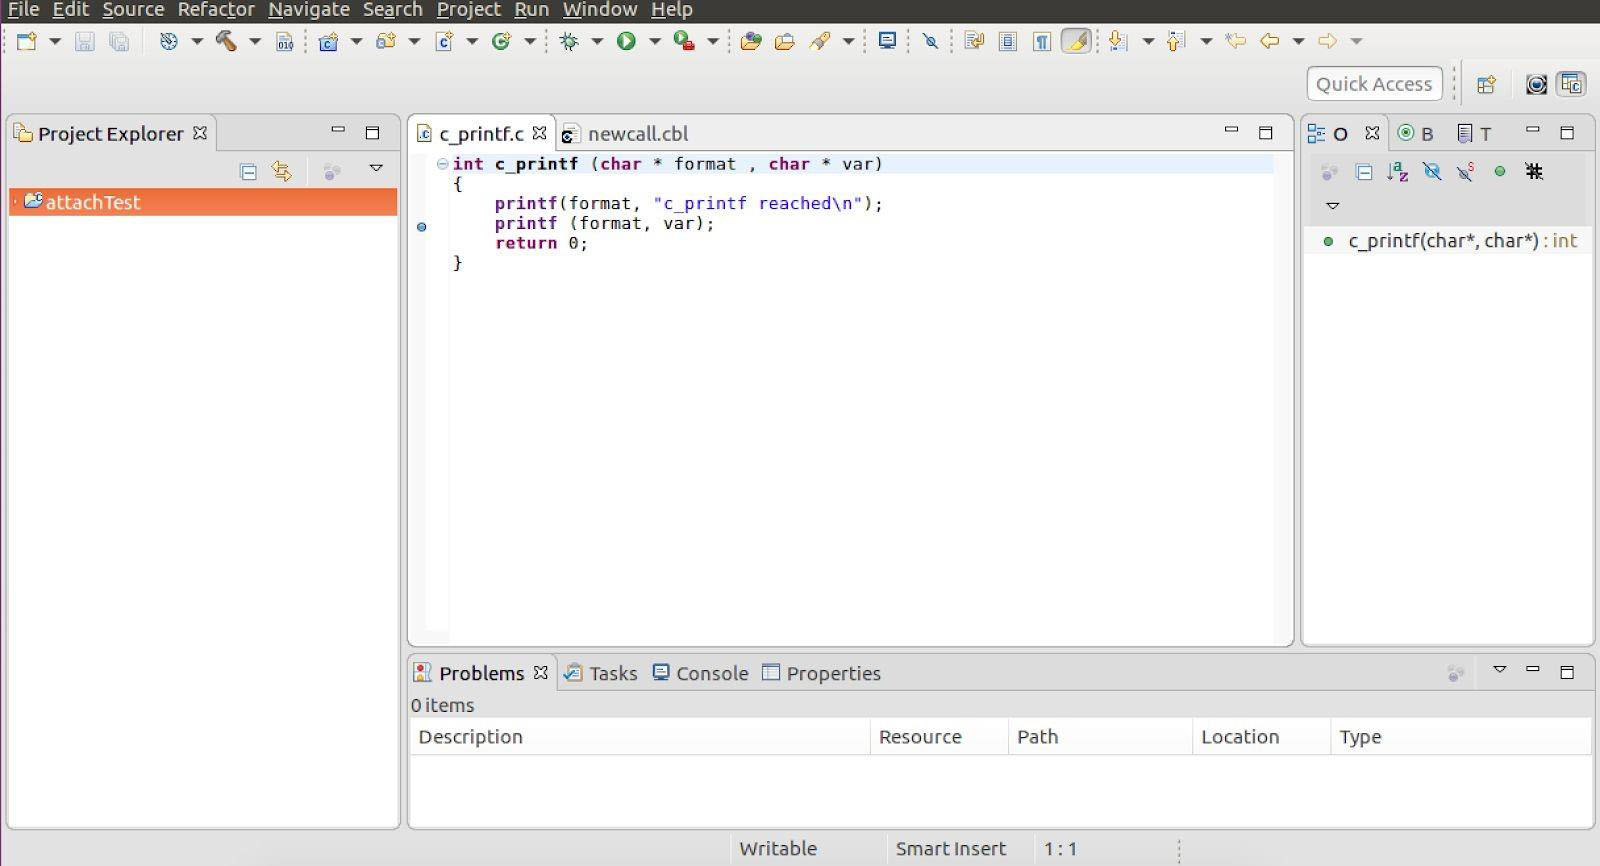
c_printf.c
c_printf is called from our main COBOL program.
We will switch to the C debugger before executing the CALL of this function.
       int c_printf (char * format , char * var)
       {
              printf (format, var);
              return 0;
       }
newcall.cbl
The CALL C$DEBUG statement allows us to attach the COBOL debugger to a process. After attaching the COBOL debugger to the process, we will then switch to the C debugger for the CALL to c_printf.
       IDENTIFICATION DIVISION.
       PROGRAM-ID.   NEWCALL.
       ENVIRONMENT DIVISION.
       DATA DIVISION.
       WORKING-STORAGE SECTION.
       01 ws-dummy PIC x.
       PROCEDURE DIVISION .
       MAIN.
              DISPLAY "NEWCALL Started"
              CALL "C$DEBUG" USING 12345
              DISPLAY "The PROGRAM will pause here" line 10 col 10.
              CALL "c_printf" USING "%s" "Hello"
              DISPLAY "Set another breakpoint here" line 12 col 10.
              EXIT PROGRAM.
Compile and link the sample programs
Compile c_printf.c with debugging information, and create a shared library called clibs.so.
As a shortcut, you can use cobc to compile the C program. In this case, use the –G compiler flag.
>cobc –G c_printf.c
c_printf.so is compiled with debugging information.
Compile newcall.cbl with COBOL debugging information (-g) and C debugging information (-G). Link c_printf.so and create an executable (-x) called newcall.
> cobc newcall.cbl –g –x c_printf.so –G
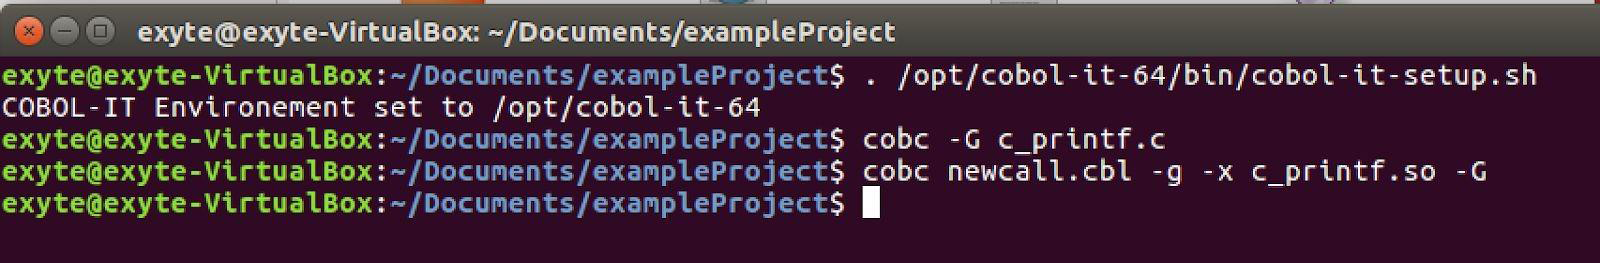
This creates an executable module called newcall, in which c_printf.so is linked to the main module.
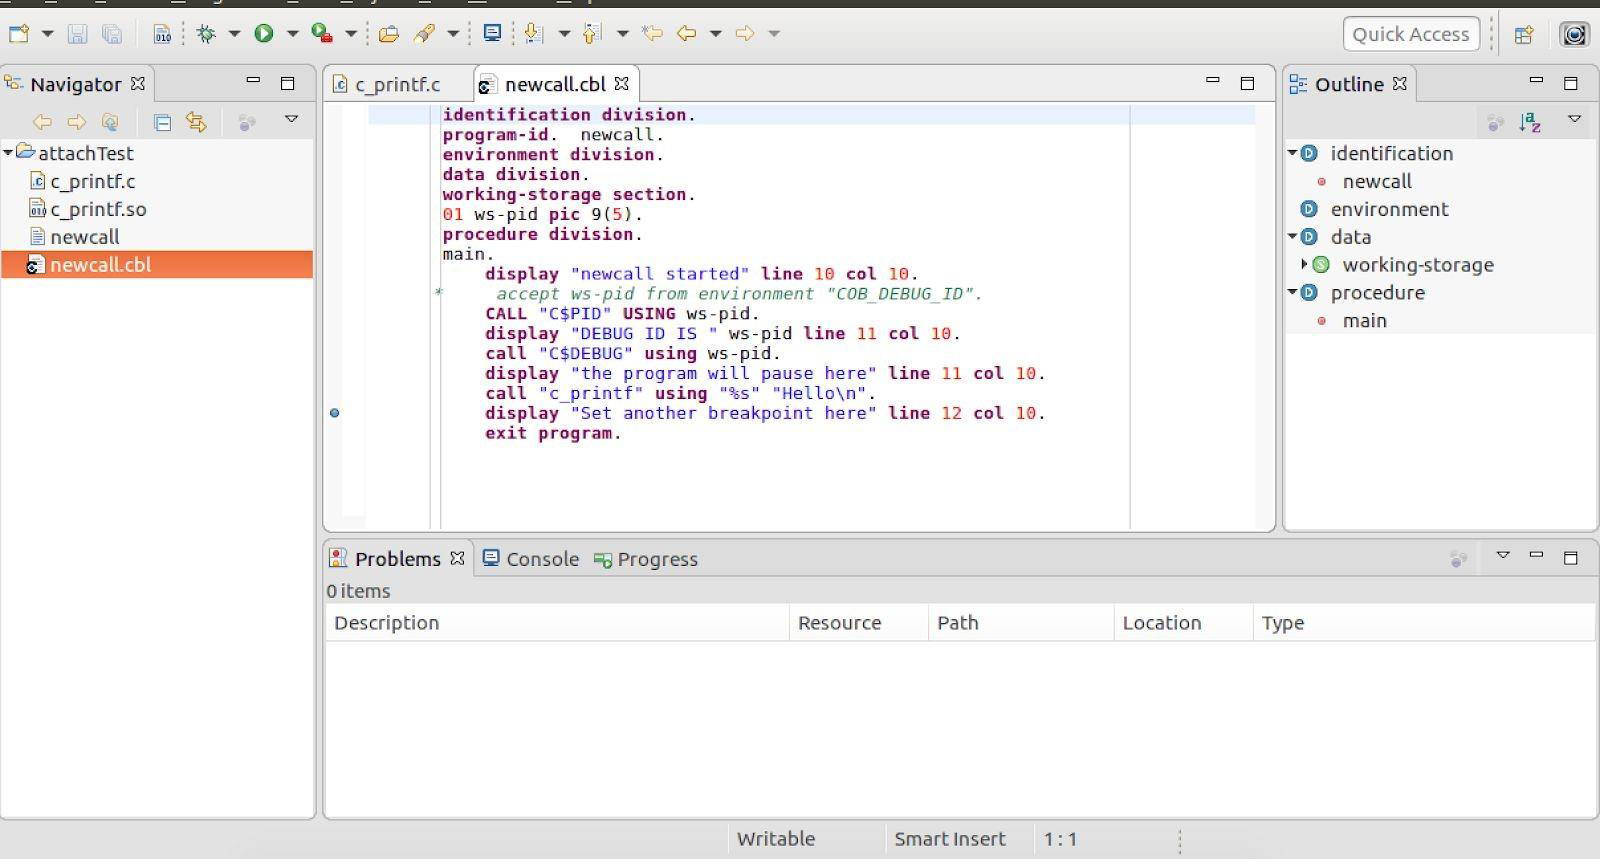
Create a New COBOL project
Drag and drop into the Project Folder: c_printf.c, c_printf.so, newcall.cbl and the executable newcall.
Open newcall.cbl in the code editor and set a breakpoint:
Add C/C++ nature to the project
Add C/C++ nature to the project. The project needs to be both a COBOL Cobol and C/C++ project at the same time.
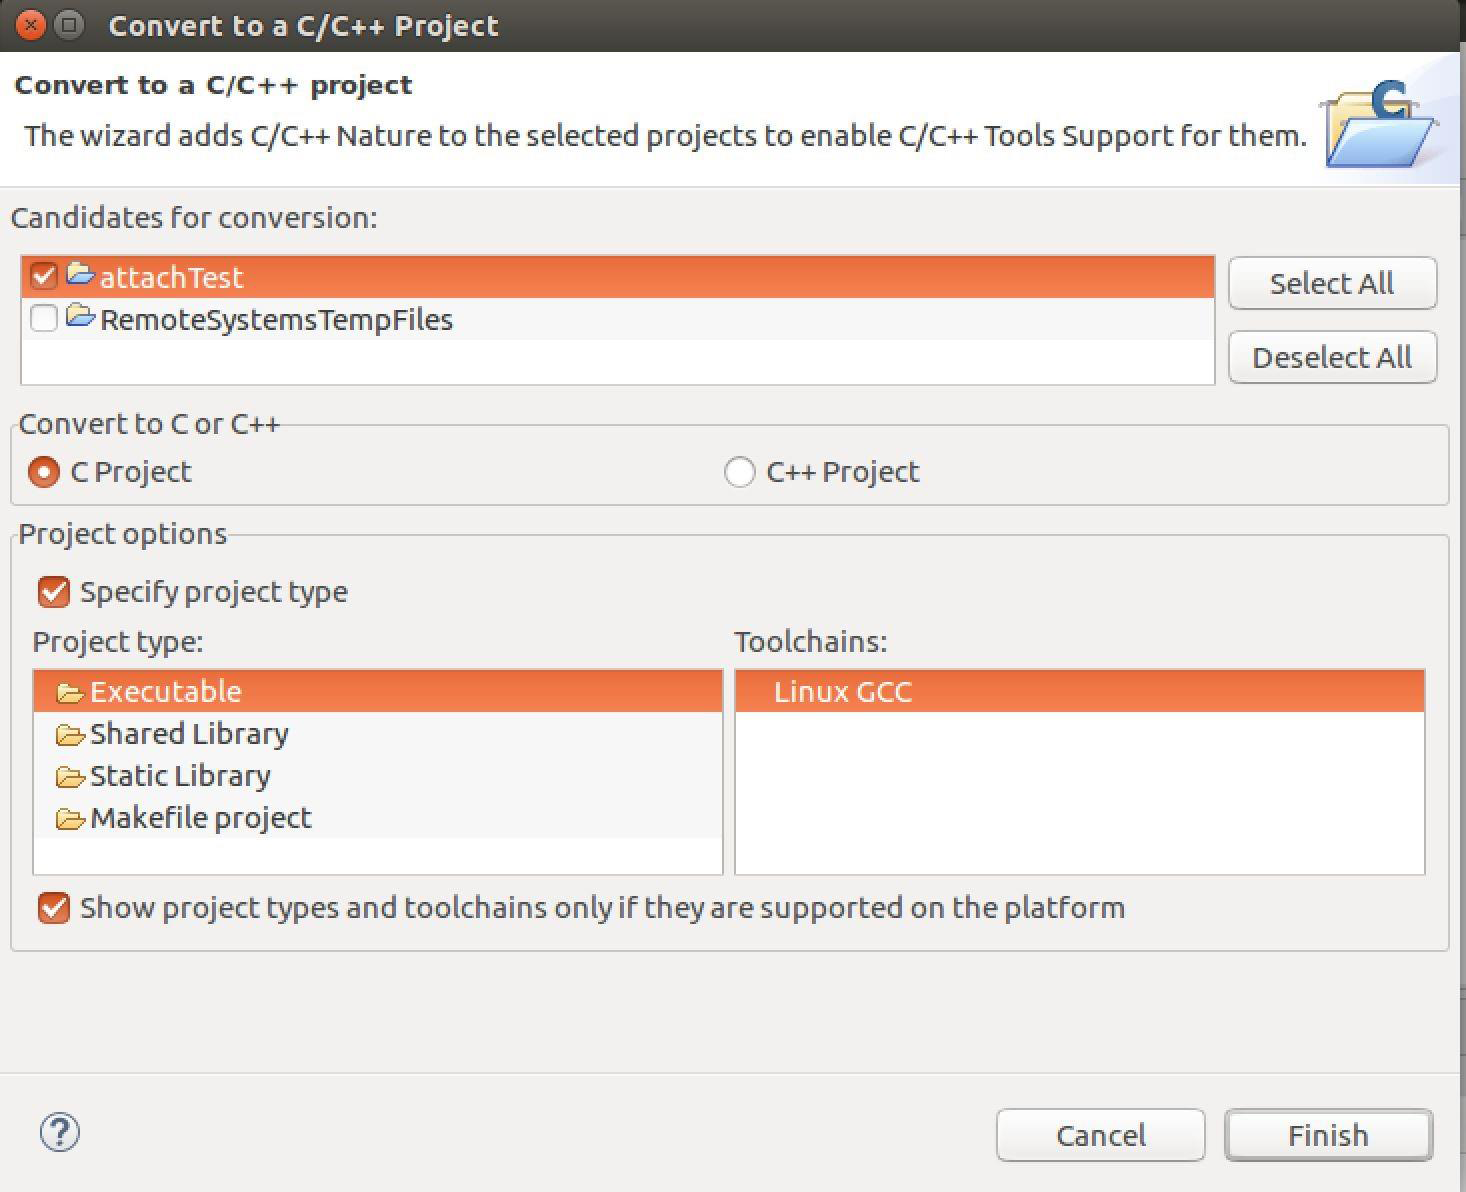
In the C/C++ Perspective , select File>New>Convert to a C/C++ Project.
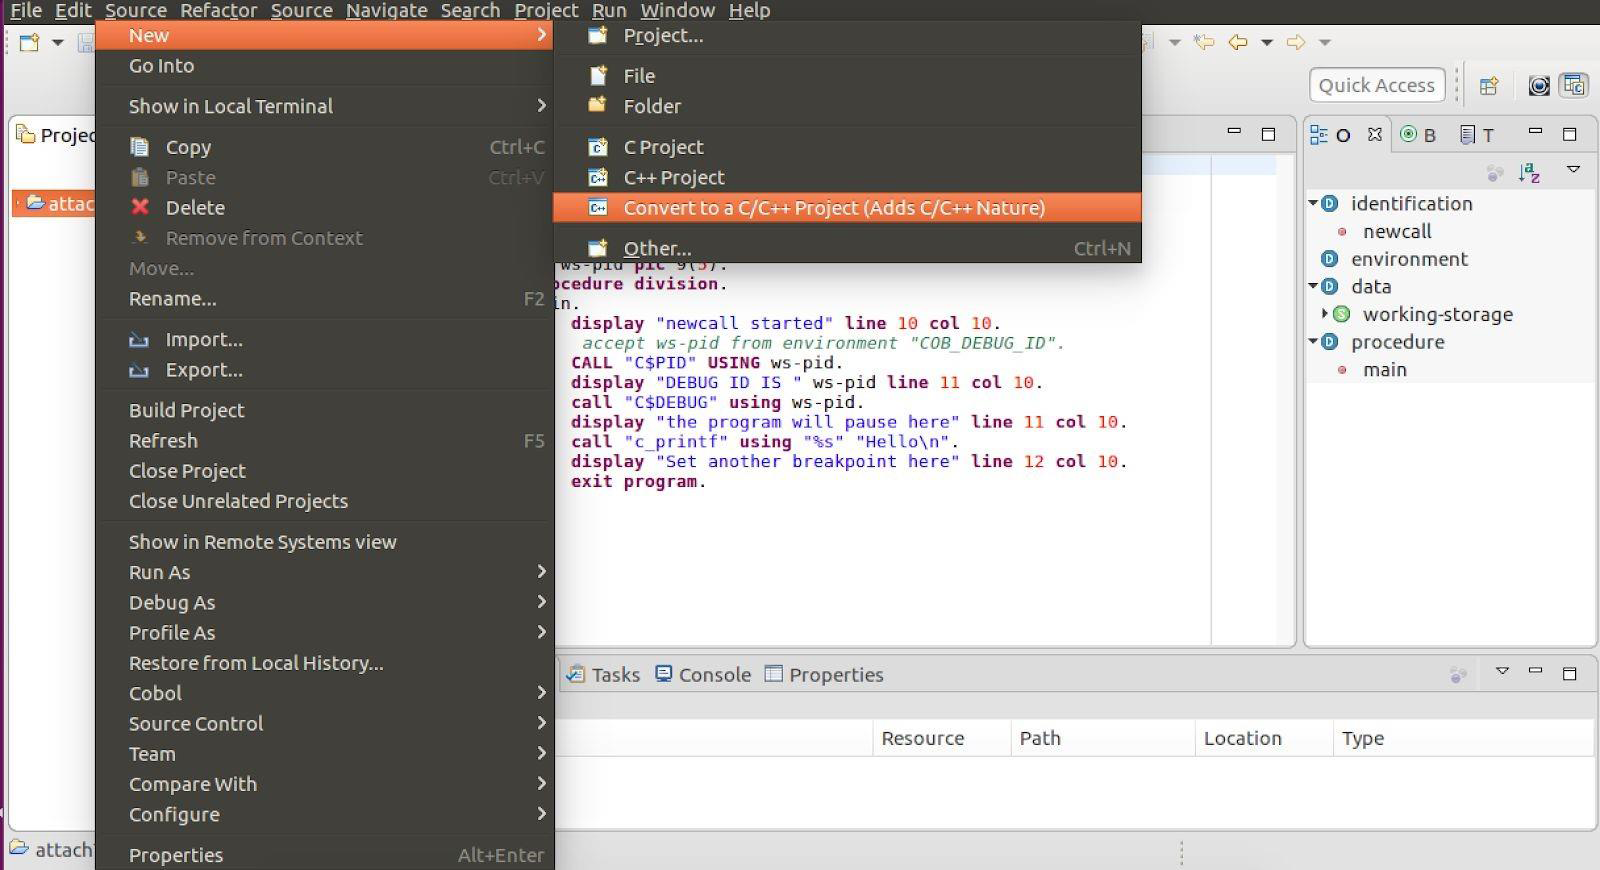
This will open the Convert to C/C++ Project Wizard:
In the C/C++ Perspective, open the C file and set a breakpoint:
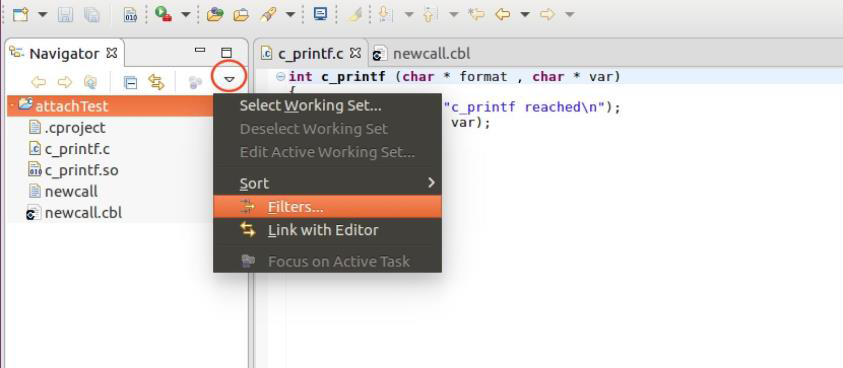
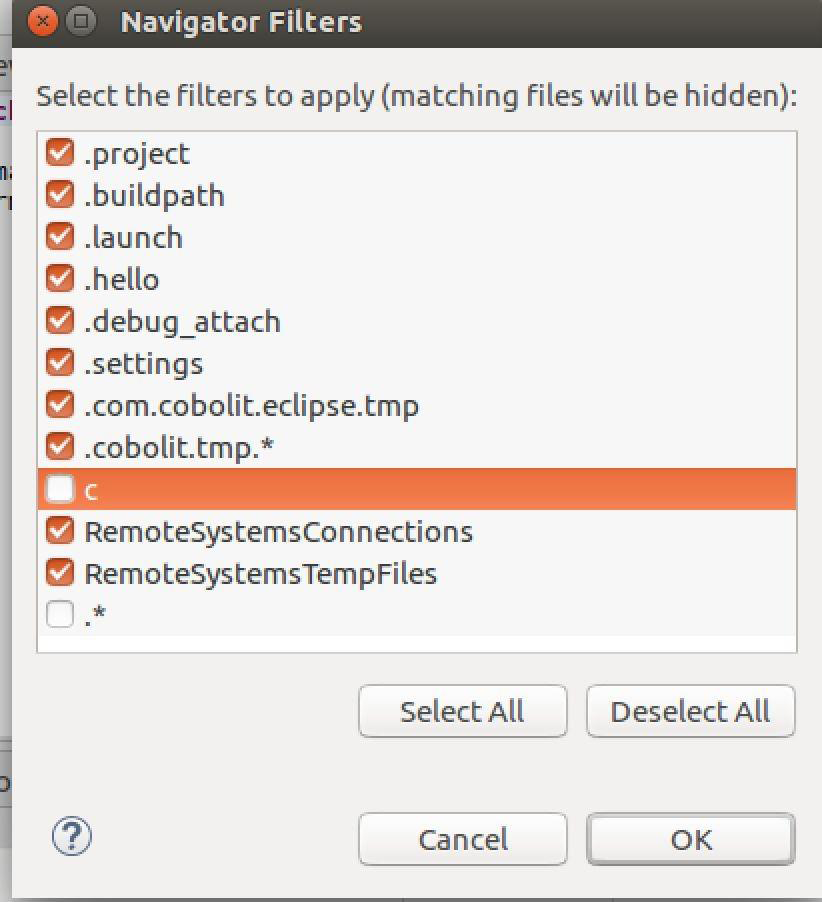
In the COBOL Perspective, in the Navigator Window, configure the visibility of the C folder by de-selecting it:
Launch the newcall executable
Run newcall from the command-line
> ./newcall
newcall pauses after the CALL C$DEBUG command.
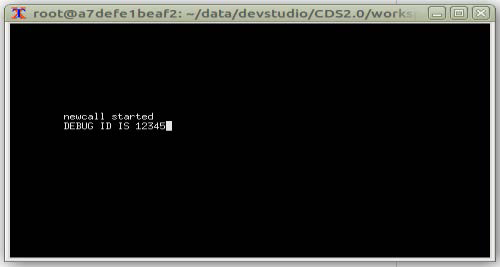
At this point, re-enter the Developer Studio.
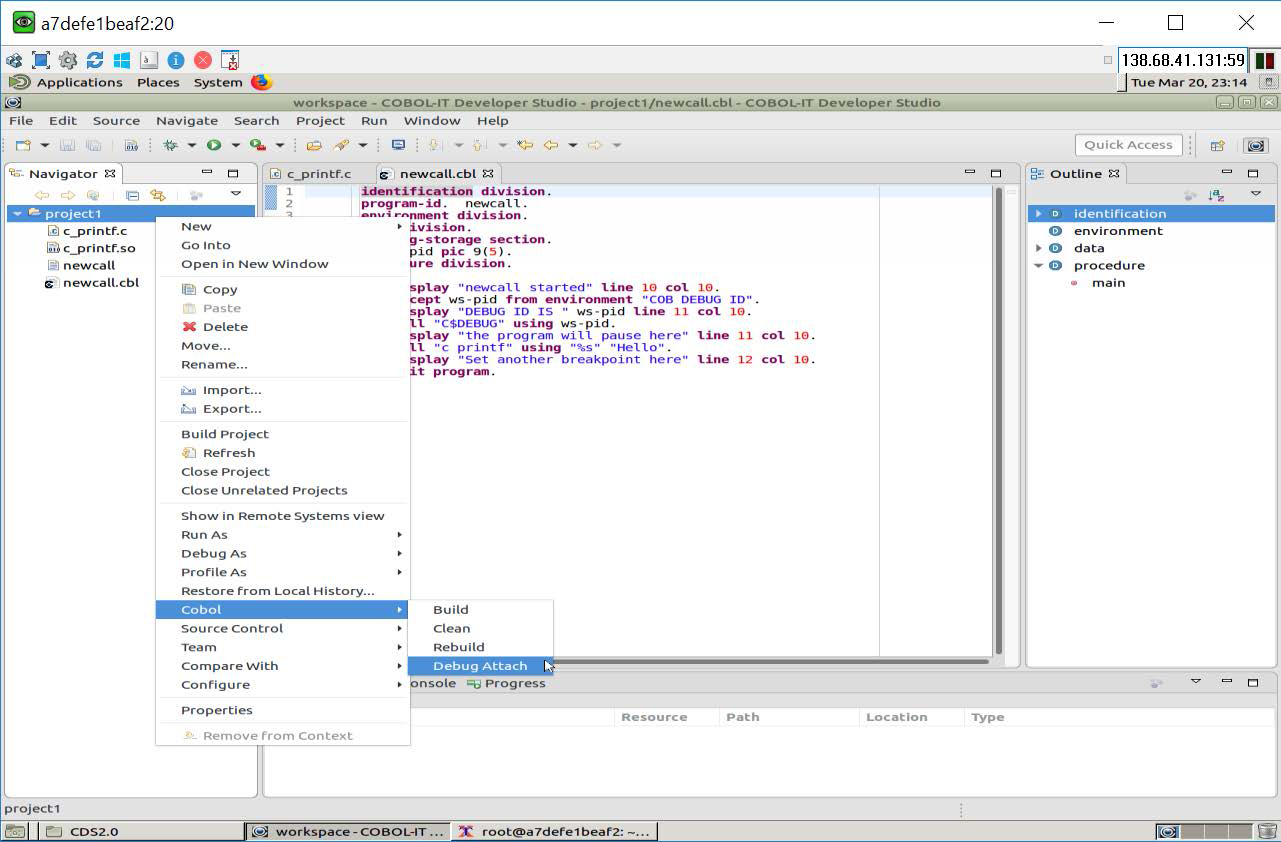
The Debug Attach function
Right-click on the Project name, and select Cobol from the menu. Then select Debug Attach.
The Reverse Attach Window
From the Reverse Attach Window, select newcall. Click on the Debug button.
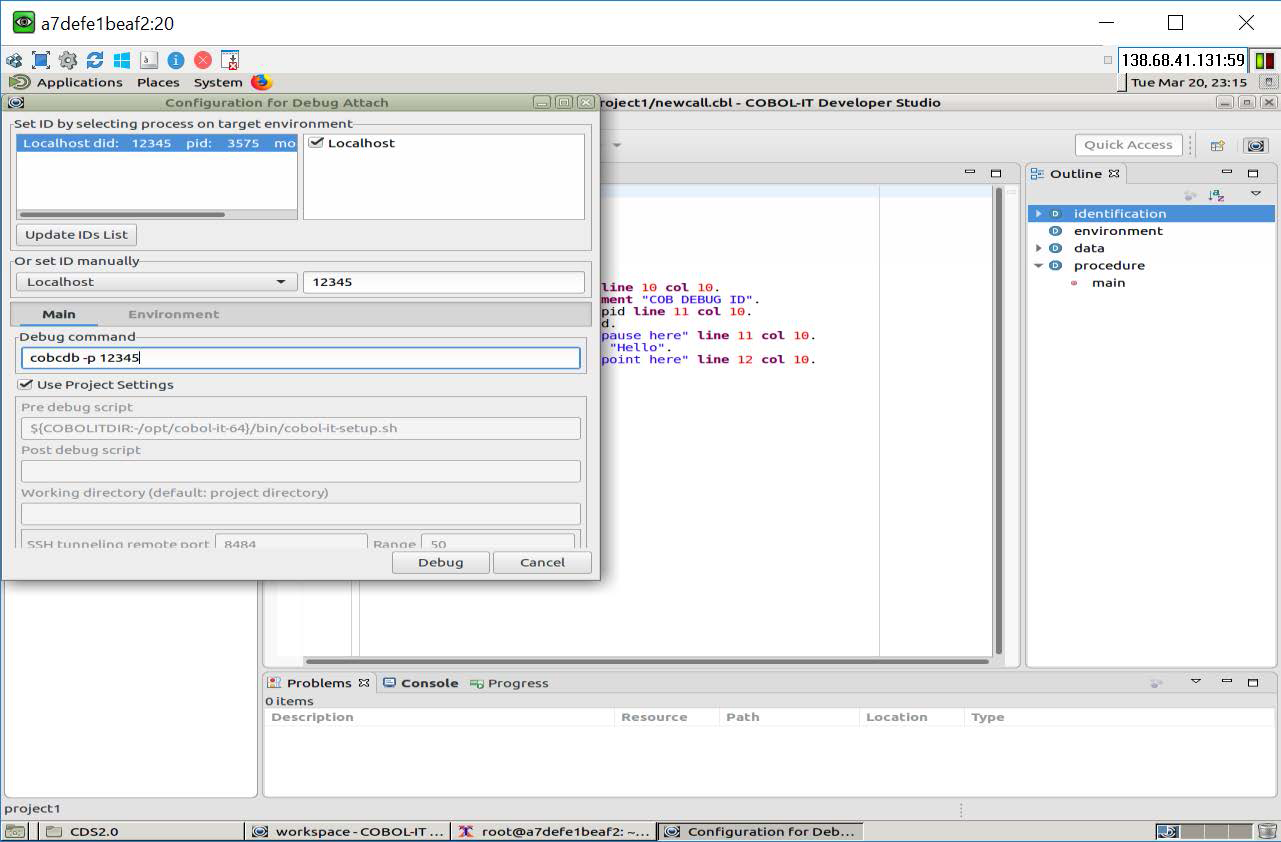
The COBOL-IT Debugger Attach
Since the source file is in the project, newcall is opened directly into the COBOL-IT Debugger Perspective.
C/C++ Debug Configuration
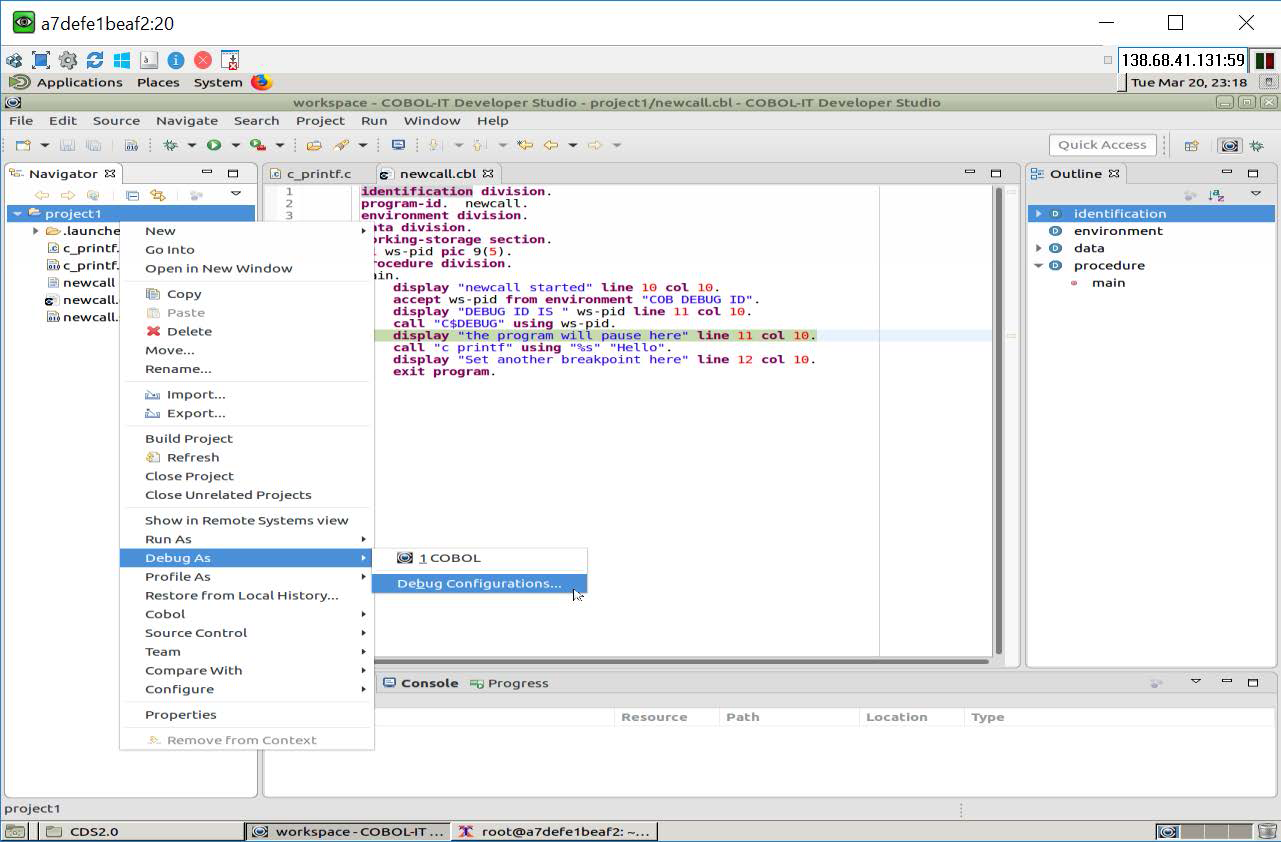
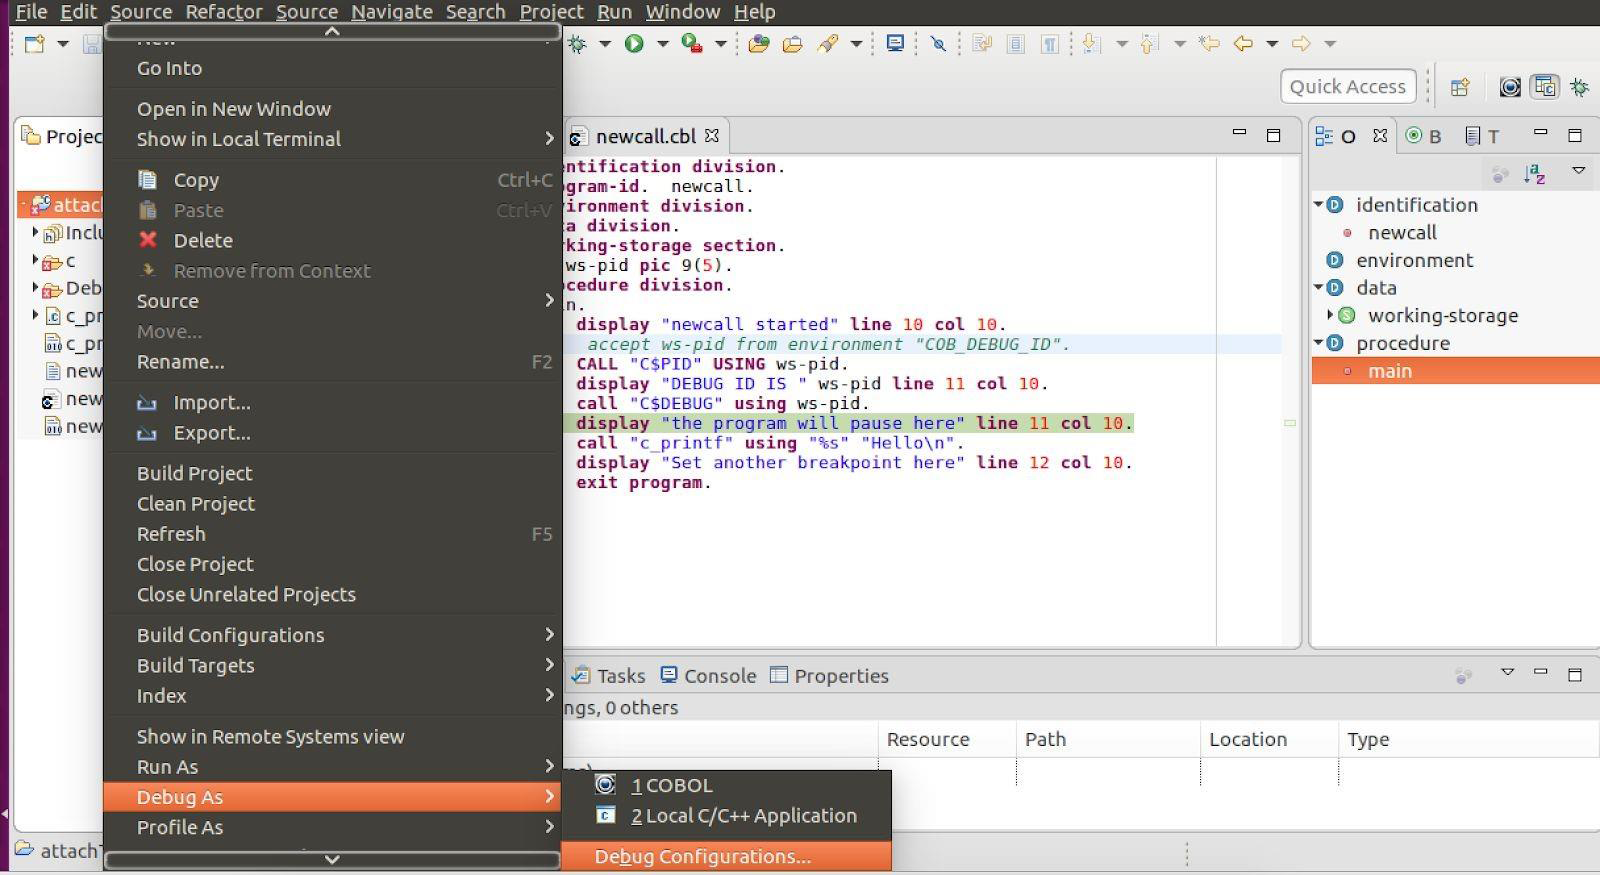
To start the C debugger, return to the Developer Studio Perspective. In the Navigator Window, select the Project by clicking on it. Right-click on the Project to open the drop-down menu. From the drop-down menu, select Debug As, and then the Debug Configurations function.
The Debug Configurations contain the interfaces to configure the C/C++ Attach to Application Functionality.
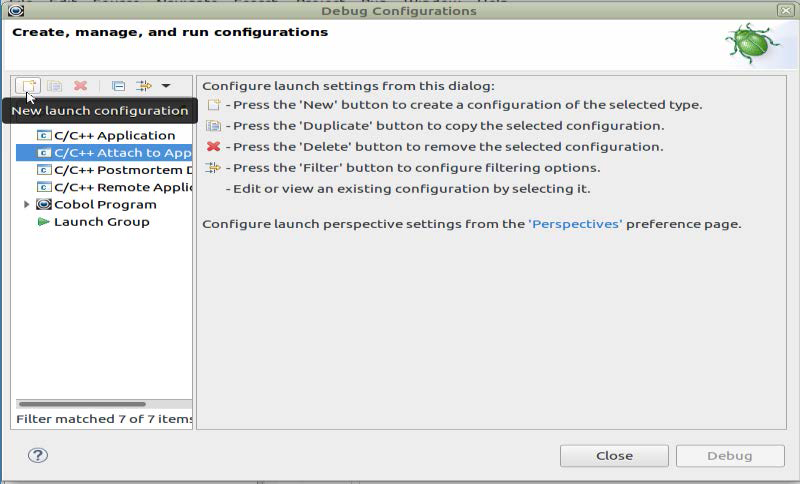
Create a new C/C++ Attach to Application
Select C/C++ Attach to Application by clicking on it. Click on the New button on the toolbar above the panel on the left to create a new configuration.
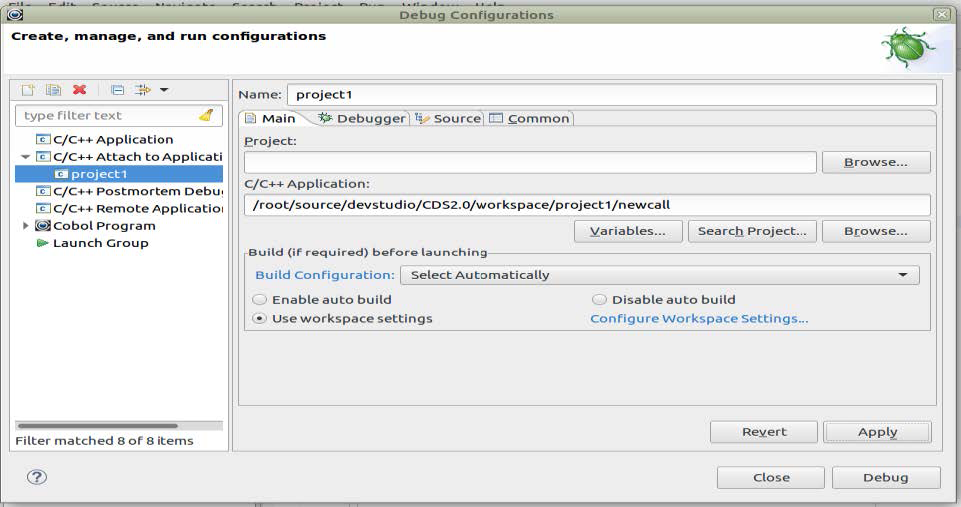
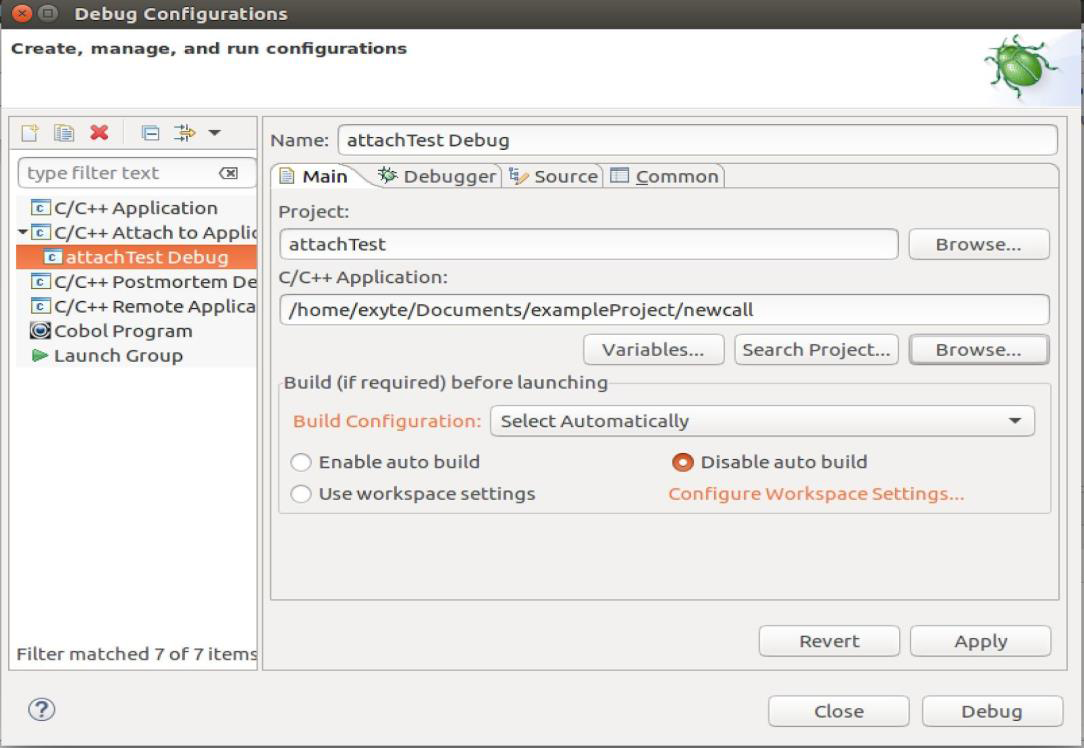
C/C++ Debug Configuration- Main Tab
The Name of your configuration is pre-filled. Enter the full path, and name of your C/C++ Application.
In our case, this is the newcall application.
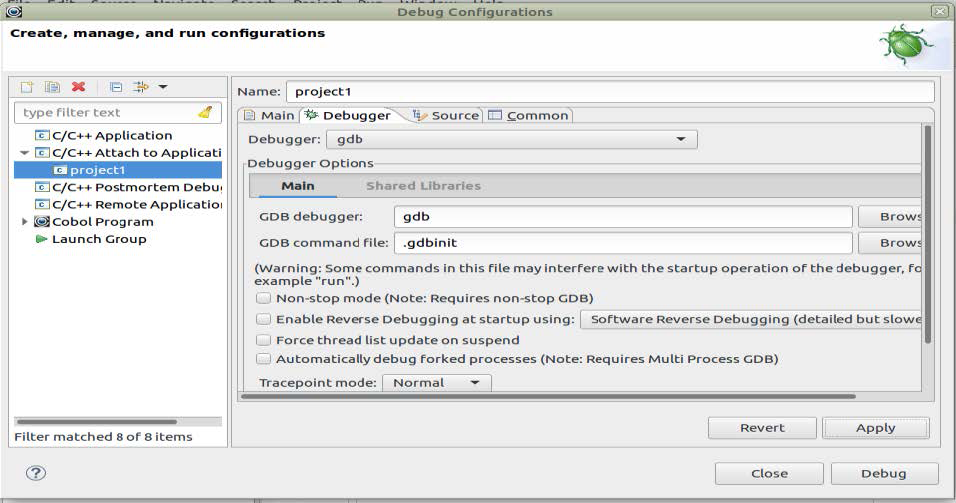
C/C++ Debug Configuration- Debugger Tab
No changes need to be made on the Debugger tab.Note that gdb is named as the debugger. gdb must be installed on your Linux machine.
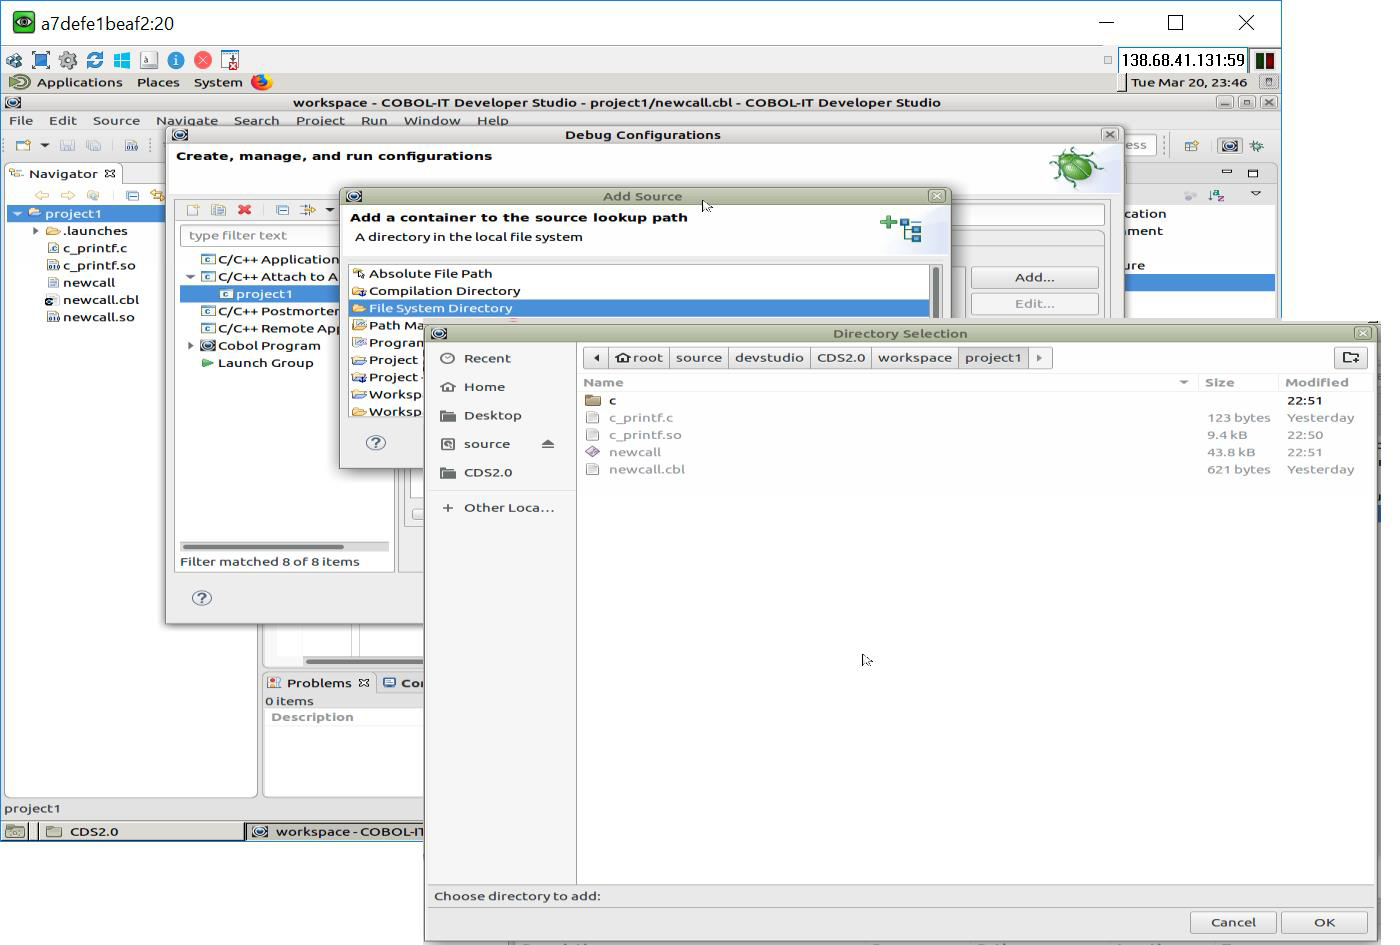
C/C++ Debug Configuration- Source Tab
Click on the Add button. In the Add Source Windows, select File System Directory. Click OK. On the Directory Selection screen, select project1. Click OK.
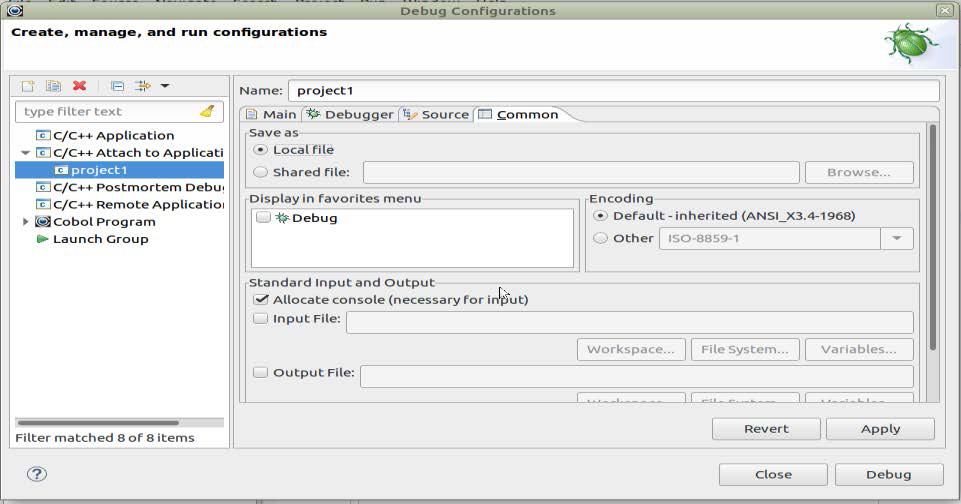
C/C++ Debug Configuration- Common Tab
No changes need to be made on the Common tab.
Select Apply. Click on the Debug button to enter the Debugger.
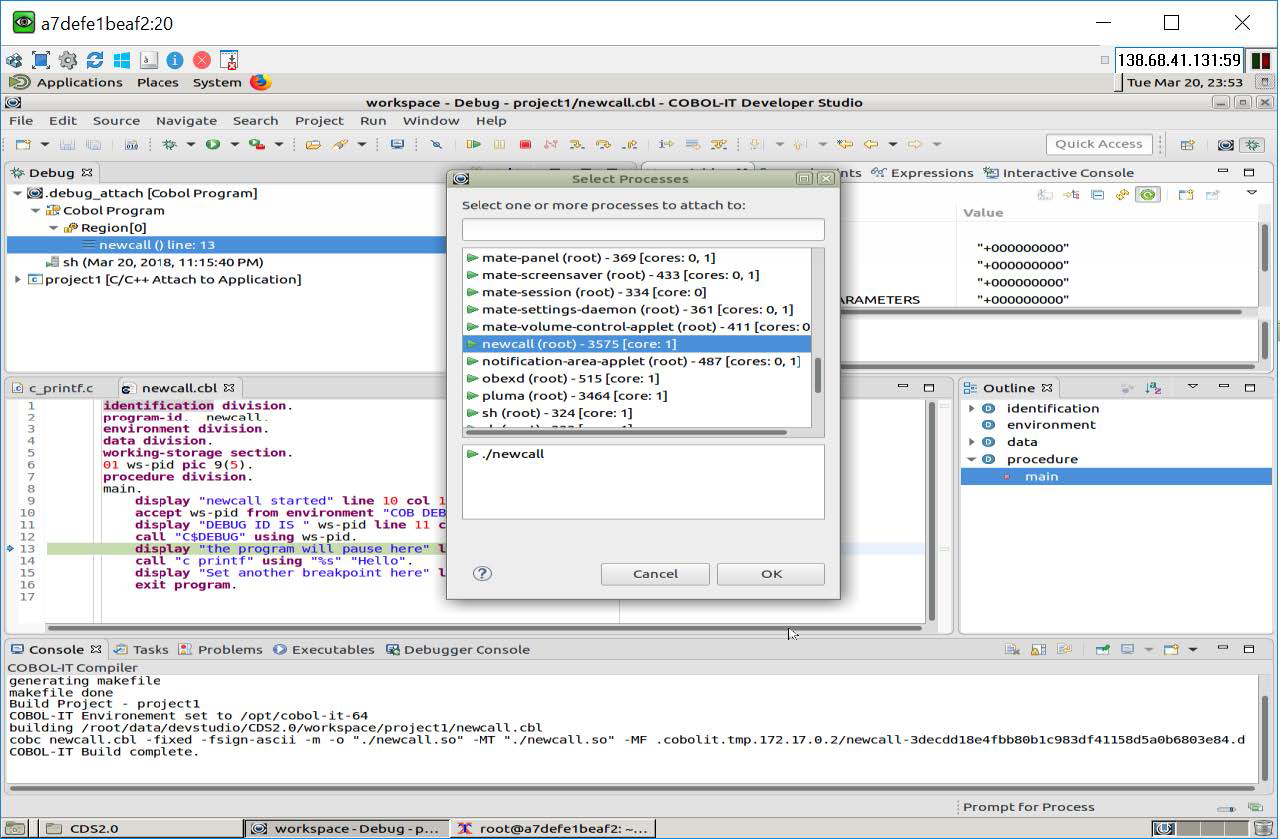
Select newcall from list of running applications
The system opens a list of running applications. Search by name or PID. Select newcall and click OK. Control returns to the Debug Window.

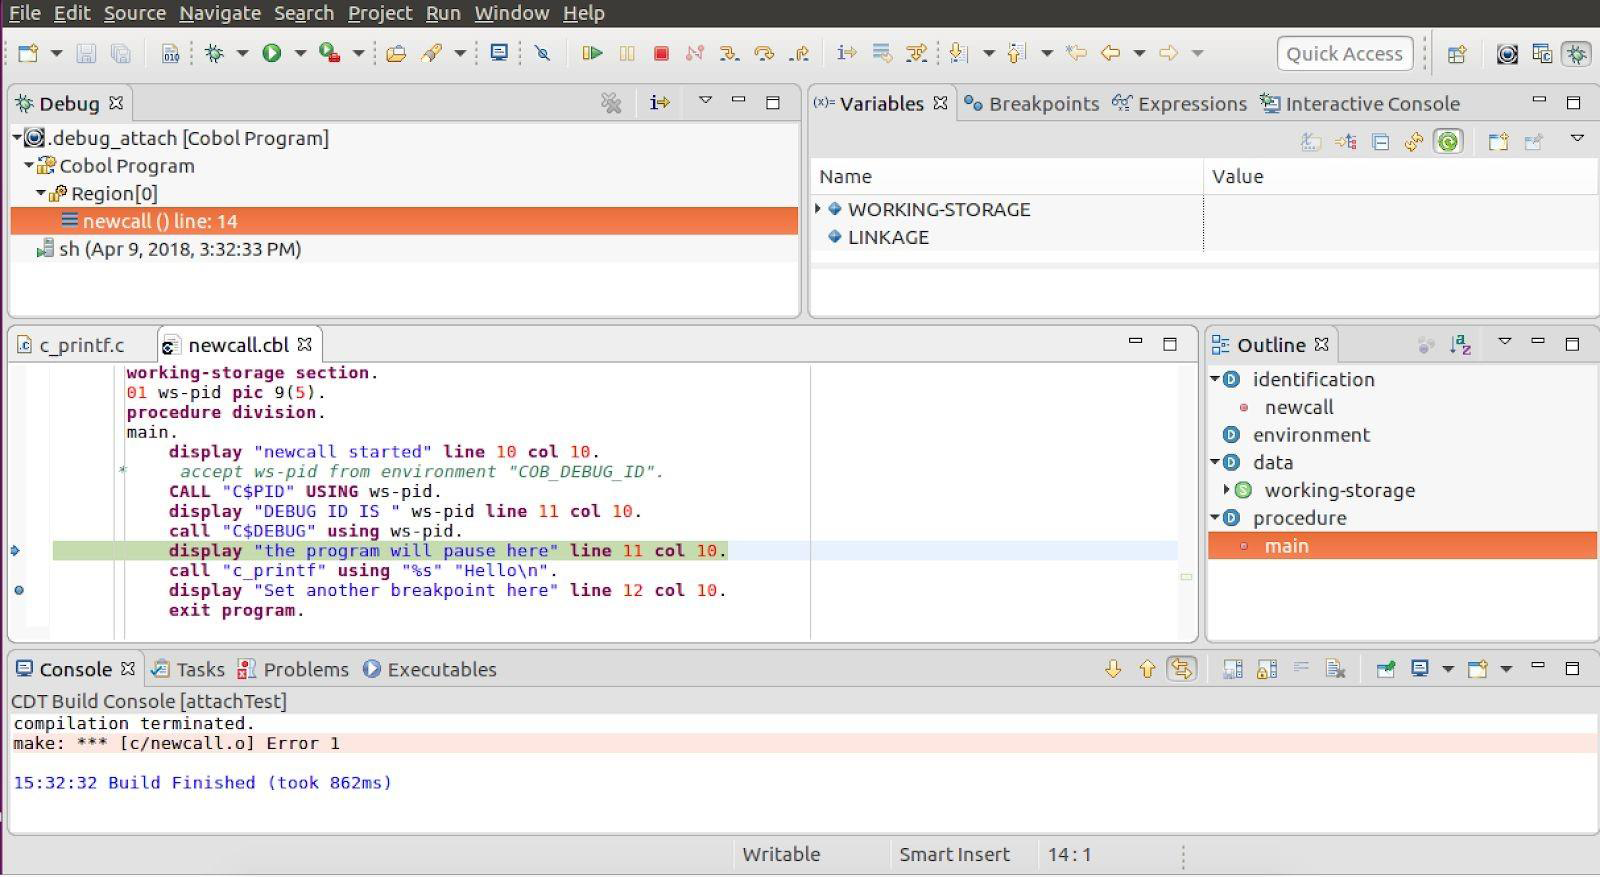
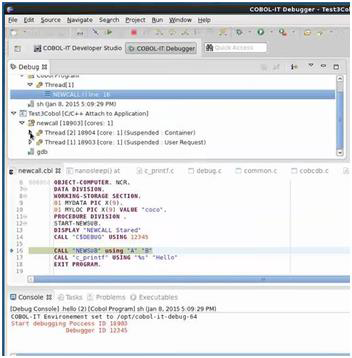
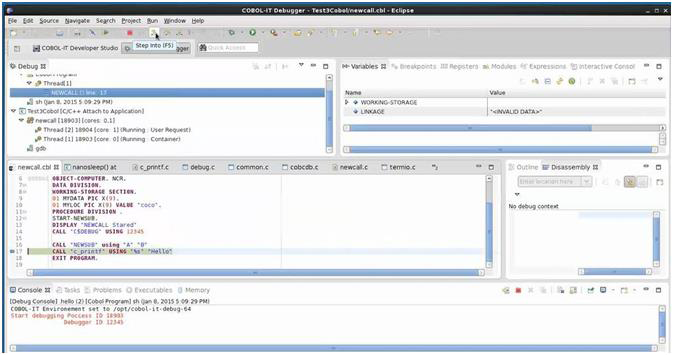
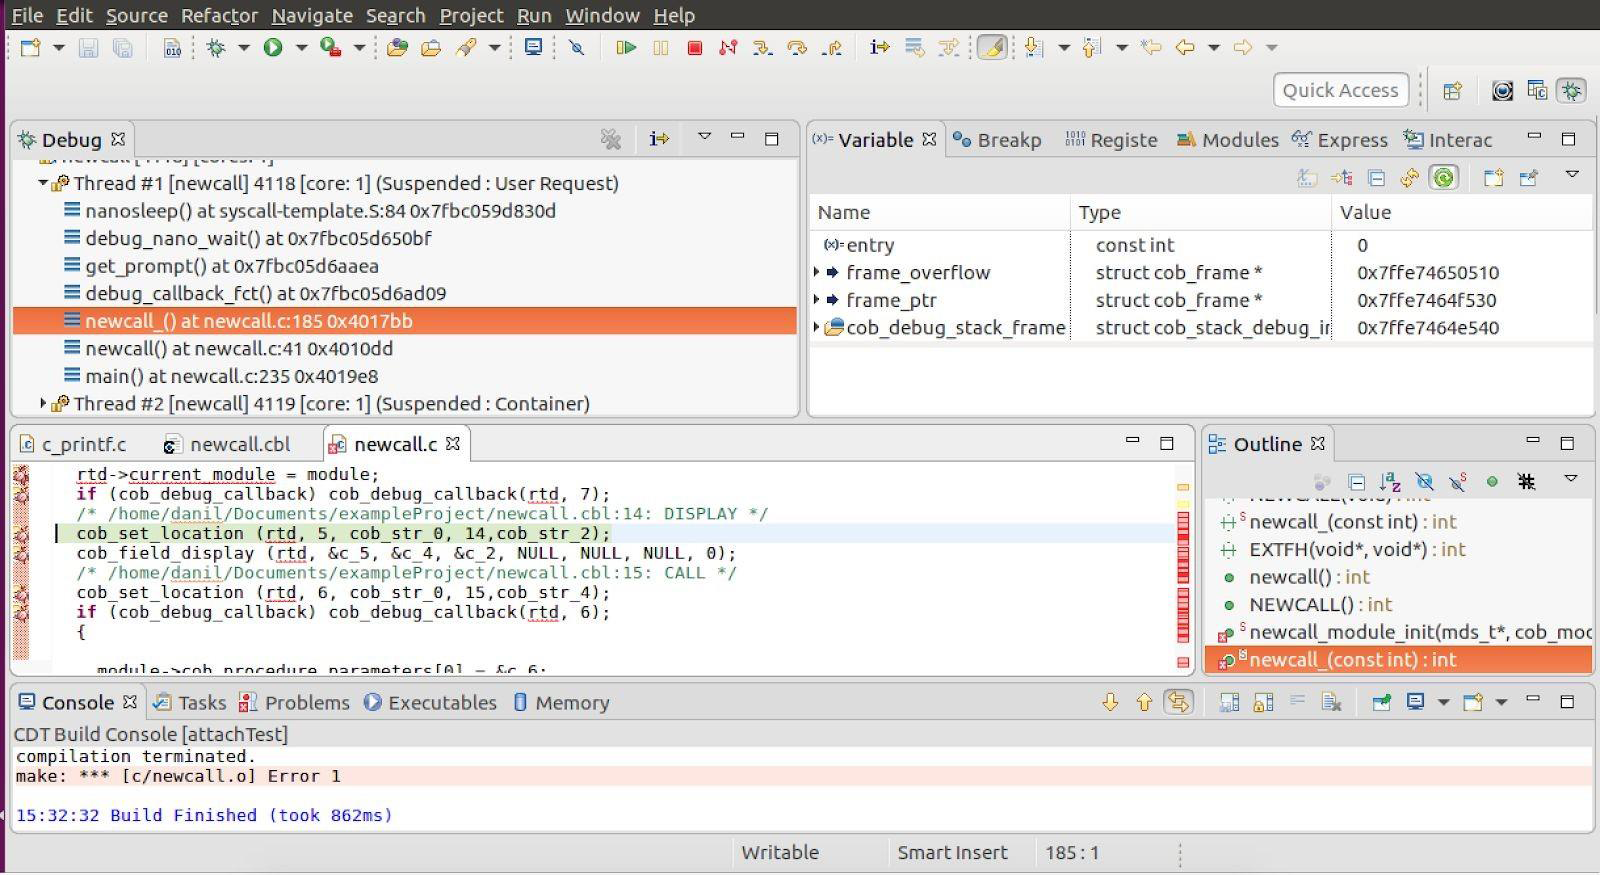
The Debugger Window- Two Debugging Sessions
There are 2 debugging sessions in the Debug Window. One of the sessions is the COBOL debugger, and the other is the C debugger. You are debugging the same application, but some of the lines are being tracked by the COBOL debugger, and some by the C debugger.
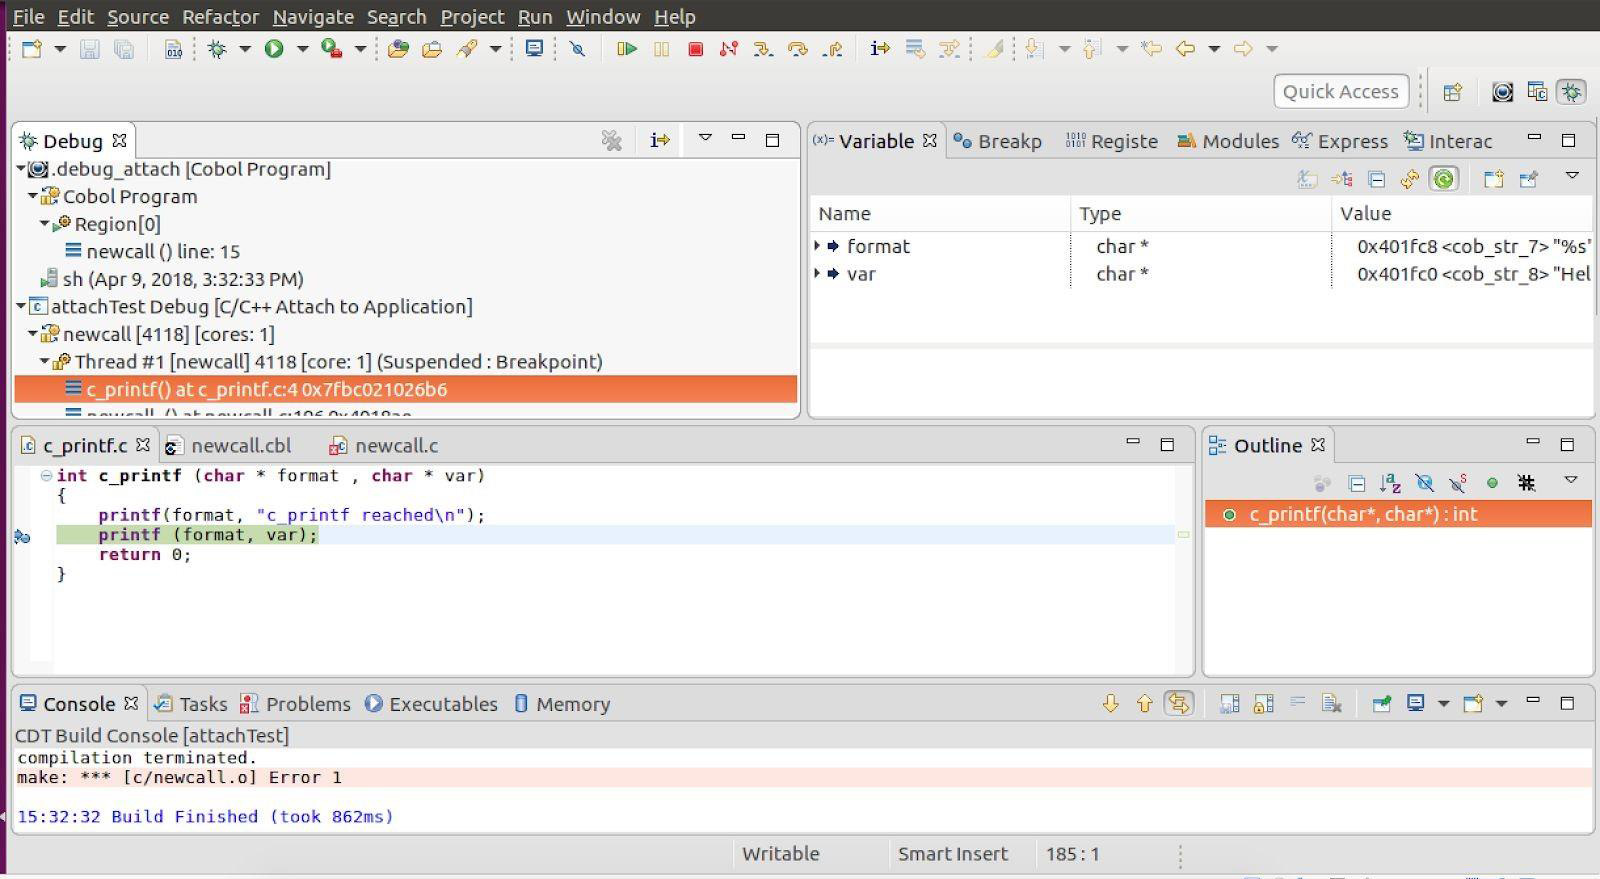
The Debugger Window- Focus on C Debugger Thread 1
Within the C debugger, there are 2 threads. Thread 2 is the COBOL Debugger Runtime. Thread 1 is the program running. Select Thread 1 by clicking on it. Now, you can open c_printf and see the C Debugger.
The “C” Debugger- Set a Breakpoint
Set a breakpoint in c_printf.c.
The breakpoint will be displayed in the Breakpoint Window.
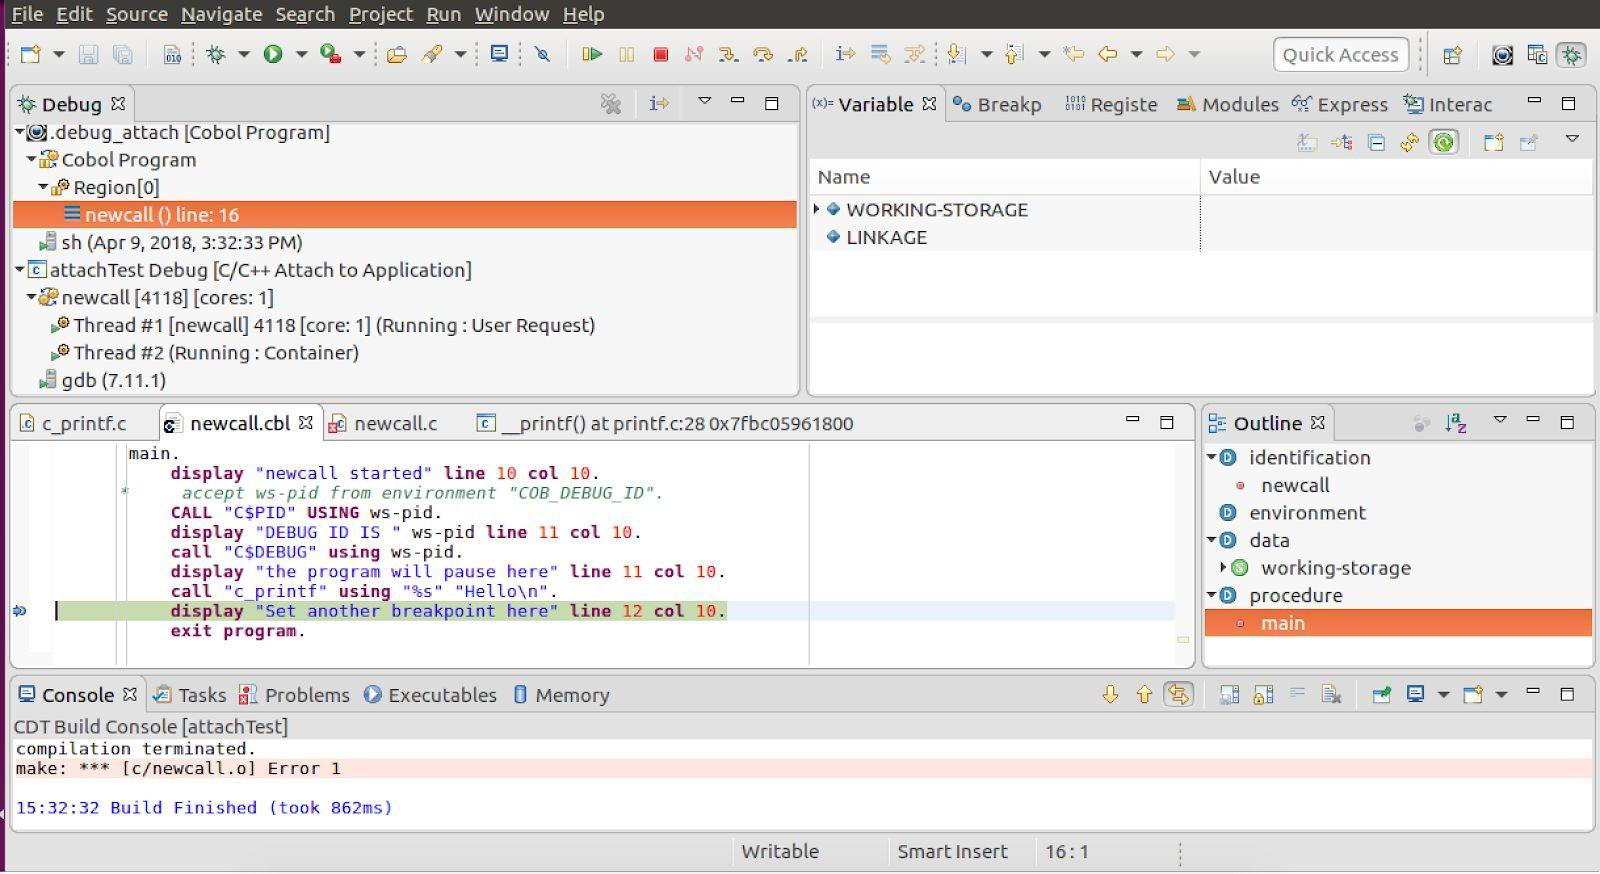
Return to newcall.cbl, and we will enter the C function, using the Step Into (F5) function.
Step Into the C Function (F5)
With the Cursor on the CALL c_printf statement, use the Step Into (F5) function to step into the C program.
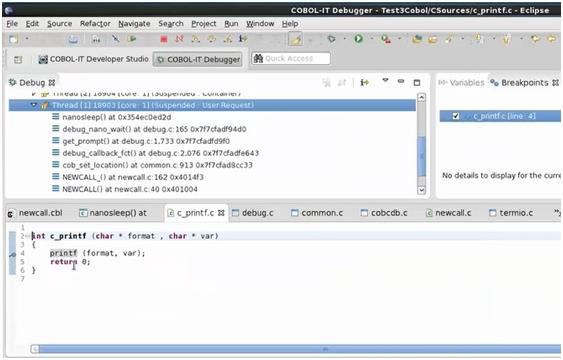
Open c_printf.c to debug.
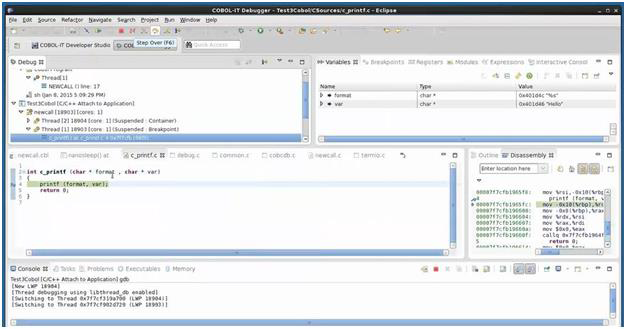
The “C” debugger
Now, you can debug on the C side. Variable values are in the Variable window. You can use the Step Functions. The C debugger will stop on breakpoints. Use the Continue function to return to the COBOL program. Set a breakpoint in the COBOL program and resume using the COBOL debugger.
Cobol and C/C++ debugging
Step 1: Open project Debug Configurations:
Step 2: Configure C/C++ Debug Attach as shown below, note that only the Main tab is important. Click Apply followed by Debug.
Step 3: Now under Debug Perspective in second debug stack frame, you can find C source files from C Folder which were configured on Step 6.
Step 4: Now there are two running debuggers. You should click Resume in both debuggers and you will see that debugger will stop on breakpoint in C program.
Step 5: Now you can debug C program. When you need to switch to a breakpoint in Cobol source file, click Resume in C debugger and the debugger will stop on next Cobol breakpoint.
In parting…
C/C++ Attach to Application is included with the Eclipse IDE for C/C++ Developers, and required.
Gdb cannot be run as a remote debugger. Both your main COBOL program and C program must be compiled with the –G compiler flag.
Attaching to the Debugger when calling COBOL from C
C$DEBUG is a COBOL routine, so it can only be called from within a COBOL program. In a CICS environment, what is needed is a mechanism to set up the Reverse Attach Debugger connection before the program is called.
Question:
Can COBOL-IT provide an API function that can be called before the program is called, so that when the runtime is started from « C », the runtime can set the breakpoint at the start of the program, and attach to the debugger with the specified debug-id?
Answer:
Yes. To do this, before stating the entry COBOL program, call:
cob_runtime_debugger_activate(rtd, did);
Where did is the debug ID used in Eclipse to connect to the debugger. The runtime will then stop on the next COBOL statement.