Profiler
The Profiler records where your application uses CPU time, elapsed time, memory, and CPU processing power. Gathering Profiling data is very simple:
- Compile your source files with
-fprofiling - Run the program
- Analyze the coverage data
After you have set your Project>Properties to include the profiling compiler flag, profiling data is produced automatically when you run (or run in debug) your program. The results are are presented in the Profiler View. Information gathered on the level of the Paragraph/Section included number of times entered, time elapsed, CPU time elapsed, external calls, and time elapsed in external calls. When running in the UNIX/Linux operating environments, you also have access to Memory and CPU usage, displayed in real time.
The Profiler stores the output for a runtime session in a single .xls file that is output at the program exit. The single output file is created using the naming convention:
cob_profiling_<PID>_final.xls.
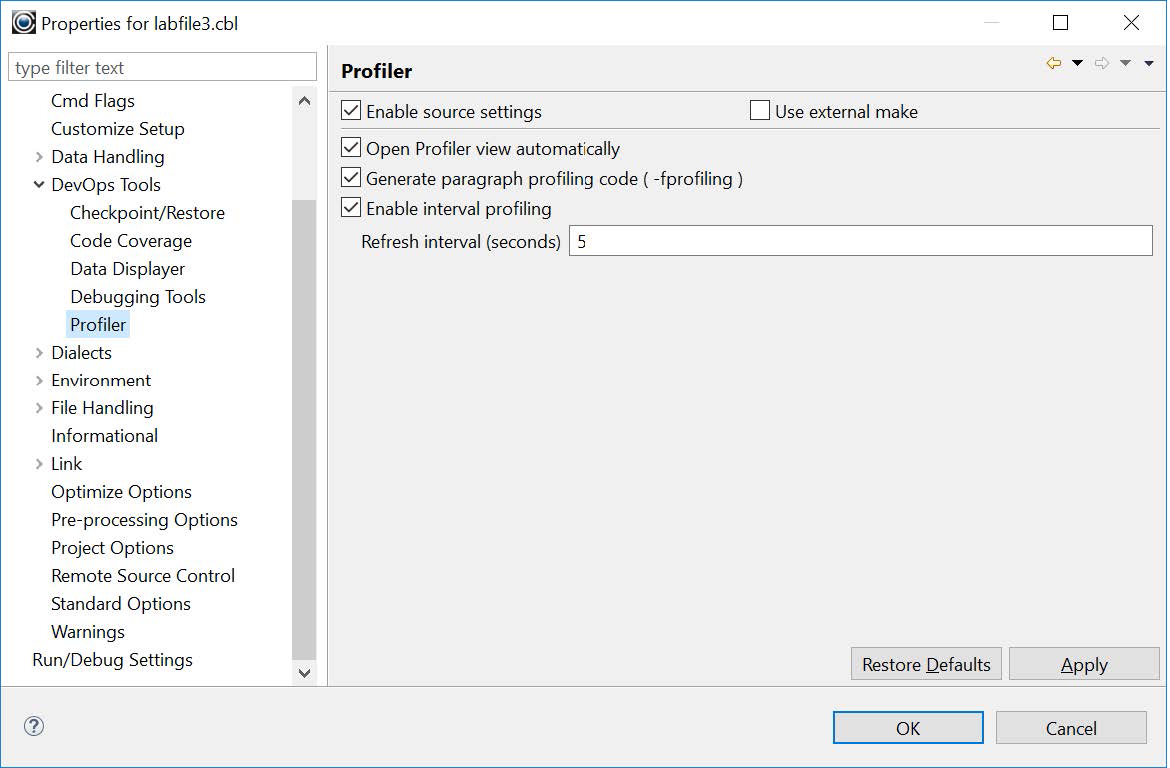
Profiling Preferences
The behavior of the COBOL Profiling can be adjusted in the Project>Properties>DevOpsTools>Profiler.
| Option | Behavior |
|---|---|
| Open Profiling View automatically | Whenever a new profiling session becomes active the Profiling View can be automatically shown in the current workbench window. (Default: on). |
Generate paragraph profiling code (-fprofiling) |
Sets the -fprofiling compiler flag. |
| Enable interval profiling>Refresh interval (seconds) | Sets the interval for the profiling data display in the runtime tab of the Profiler View. |
Runtime Environment Variables COB_PROFILING_DIR
When compiling with the -fprofiling compiler flag, the runtime will check for the COB_PROFILING_DIR environment variable, and generate the profiling data file in that directory if it is defined. Otherwise, the profiling data file is created in the same directory as the source file.
Note that COB_PROFILING_DIR environment variable requires a trailing slash.
As an example:
Linux/UNIX environments:
>export COB_PROFILING_DIR=mydir/
As a result, the output file is generated as mydir/cob_profiling_<pid>_final.xls
In Windows environments:
>set COB_PROFILING_DIR=mydir\
As a result, the output file is generated as mydir\cob_profiling_<pid>_final.xls
COB_PROFILING_EACH_MODULE
The COB_PROFILING_EACH_MODULE runtime environment variable, when set to Y, causes the profiler to revert to the old profiling behavior, in which the .xls file is output at the exit of each module in an application.
The Profiler View
Opening the Profiler View
The Profiler view is opened automatically after a program is run in profiling mode. As with other Views, it can be manually opened from the Window>Show View menu.
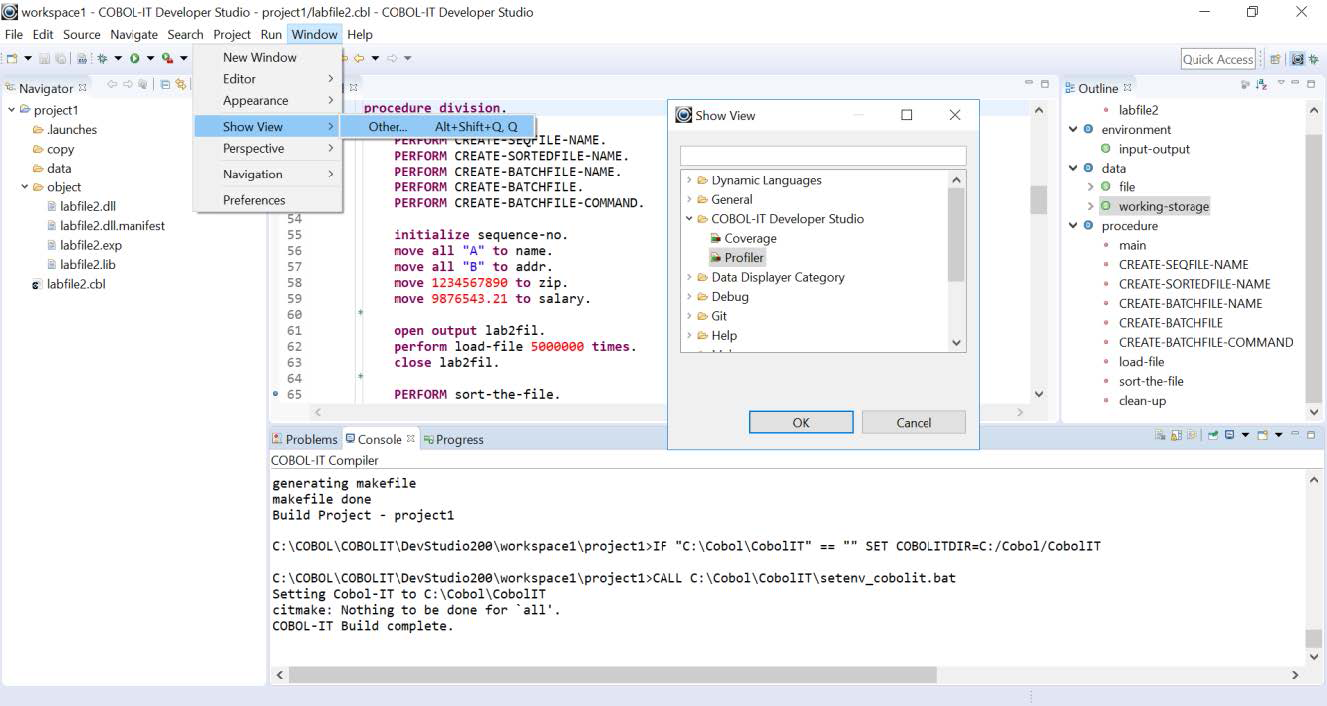
The Profiler View contains two tabs: Runtime and Paragraphs.
The Runtime tab is available in Linux/UNIX operating environments and contains information about current cpu and memory usage of the running program.
The Paragraphs tab is empty during execution. On program exit, the tab is activated and filled with the profiling information that has been collected in the cob_profiling_[pid]_final.xls file.
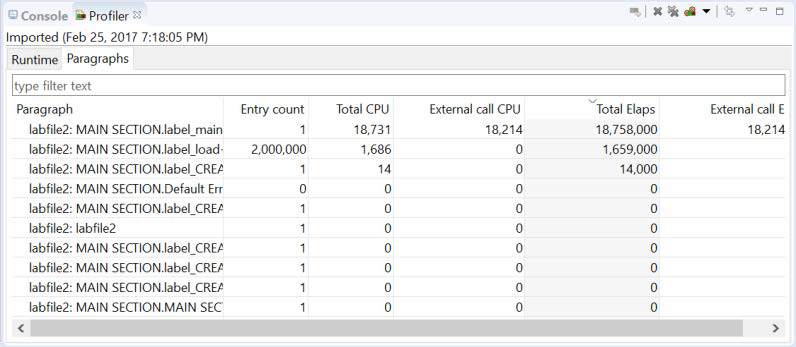
Paragraphs Tab
The Paragraphs Tab of the Profiler View shows profiling information collected during the runtime session.
Profiler View Summaries
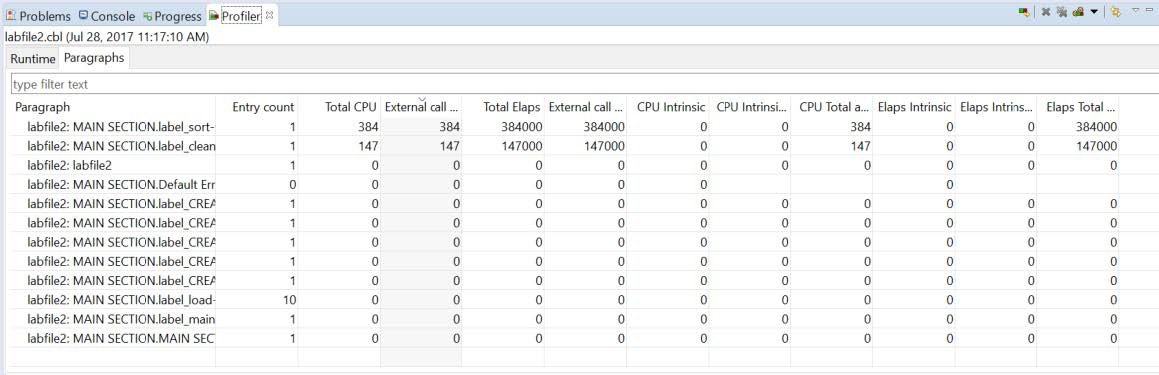
On the Title bar, you see the name of the main program, and the data-time stamp for the profiling session.
In the Paragraphs Tab, you will find the following columns:
| Column | Displays |
|---|---|
| Paragraph | In the form [program name]:[section name].label_[paragraph name]. |
| Entry Count | The number of times the paragraph was entered. |
| Total CPU | CPU time in thousandths of a second. |
| External CALL CPU | CPU time spent in external calls in thousandths of a second. |
| Total Elaps | Total elapsed time in millionths of a second. |
| External Call Elaps | Total elapsed time in external calls in millionths of a second. |
| CPU Intrinsic | CPU time executing Intrinsic Functions. |
| CPU Intrinsic avg run | CPU time executing Intrinsic Functions (average run). |
| CPU Total avg run | CPU Total (average run). |
| Elaps Intrinsic | Elapsed time executing Intrinsic Functions. |
| Elaps Intrinsic avg run | Elapsed time executing Intrinsic Functions (average run). |
| Elaps Total avg run | Total elapsed time (average run). |
The elements may be sorted in ascending or descending order by clicking the respective column header.
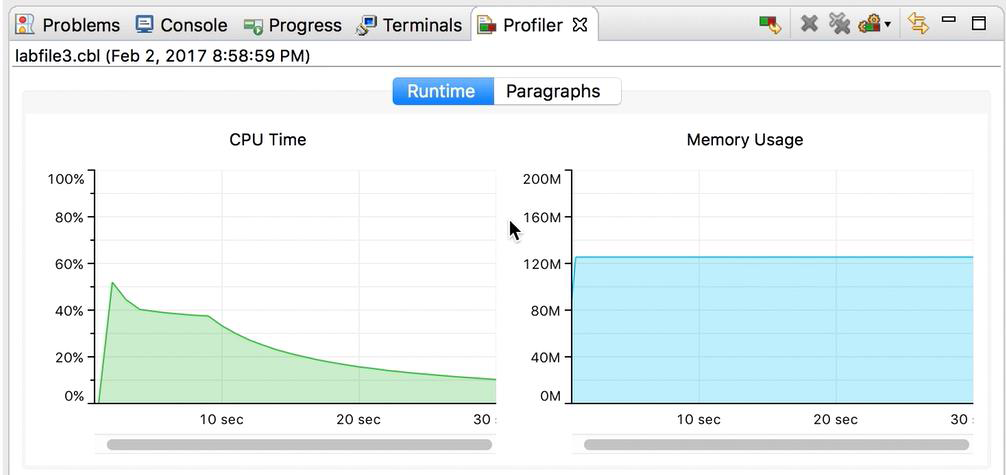
Runtime Tab
In Linux/UNIX operating environments, the Runtime tab contains two graphics with cpu and memory information of the running program. During program execution graphics data is updated at an interval rate that is configurable by the user.
The Profiler View Toolbar
The Profiler View Toolbar:
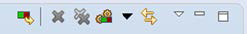
| Toolbar Icon | Name | Function |
|---|---|---|
| Relaunch Profiler Session | Re-run the currently selected profiler session. | |
| Remove Active Session | Remove the currently selected profler session. | |
| Remove All Sessions | Remove all profiler sessions. | |
| Select Active Session | Select session from the drop down-menu and make it the active session. | |
| Link with Current Selection | When this toggle is checked the Profiler View automatically opens target source code when you select a paragraph in the Paragraphs tab. | |
| Minimize | Minimizes the Coverage View | |
| Maximize | Maximizes the Coverage View |
Relaunch Profiler Session
The Relaunch Profiler Session toolbar button causes the application to be re-launched in the debugger. When the application session has completed the Profiling results will be displayed as the new Active Session.
Select Active Session
The Active Session dropdown box displays the currently active session and sessions which can be selected as the Active Session. The selected session is displayed in the Profiler View.
Link with Current Selection
The Link with Current Selection toolbar button opens the selected source file in the Code Editor Window.
Profiler Session Import
Profiling sessions can be launched from the COBOL command line. As we have seen, when you compile a program with the -fprofiling compiler flag, and then run the program, the runtime will create an output file called cob_profiling_[pid]_final.xls. This file can be imported into the Developer Studio.
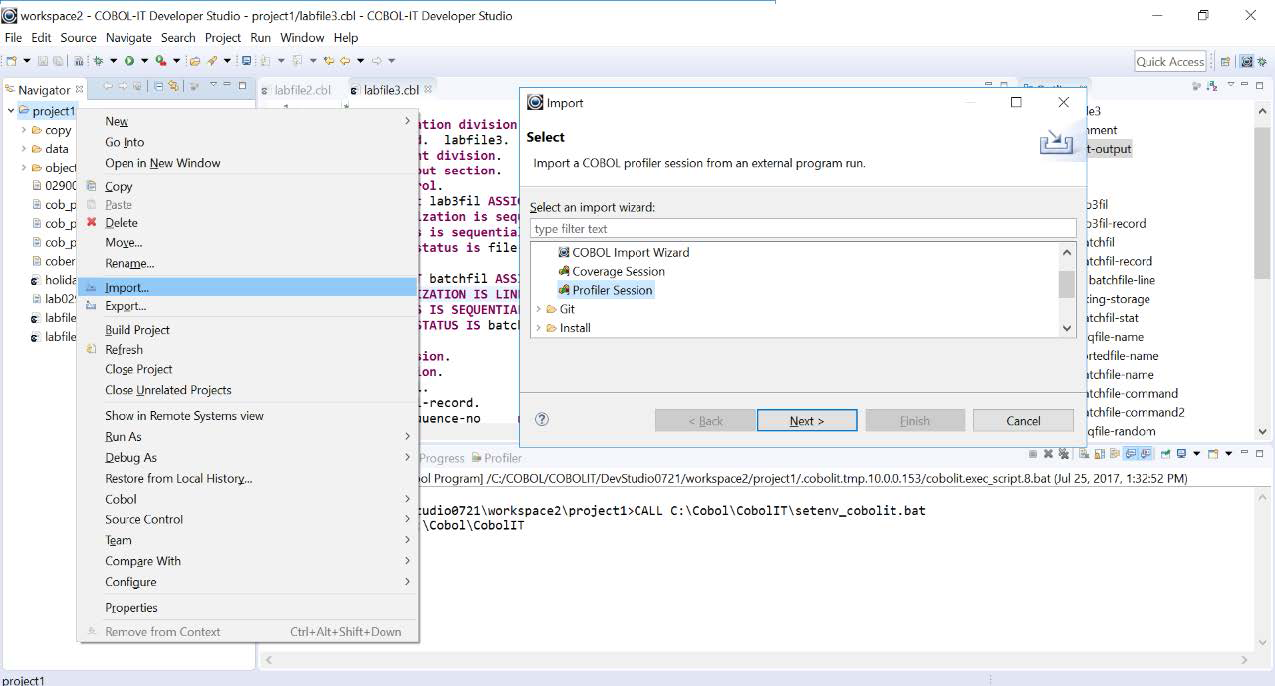
To import a Code Coverage session, select the File>Import function from the Main Menubar. On the subsequent Import screen, select Profiler Session from among the available COBOL import wizards.
Click on the Next button to open a dialog Window, and select the Profiler Session you wish to import. Profiler sessions are stored in .xls files, as described earlier. In our example below, we have used the Browse button to navigate to a .xls file in which we have saved information.
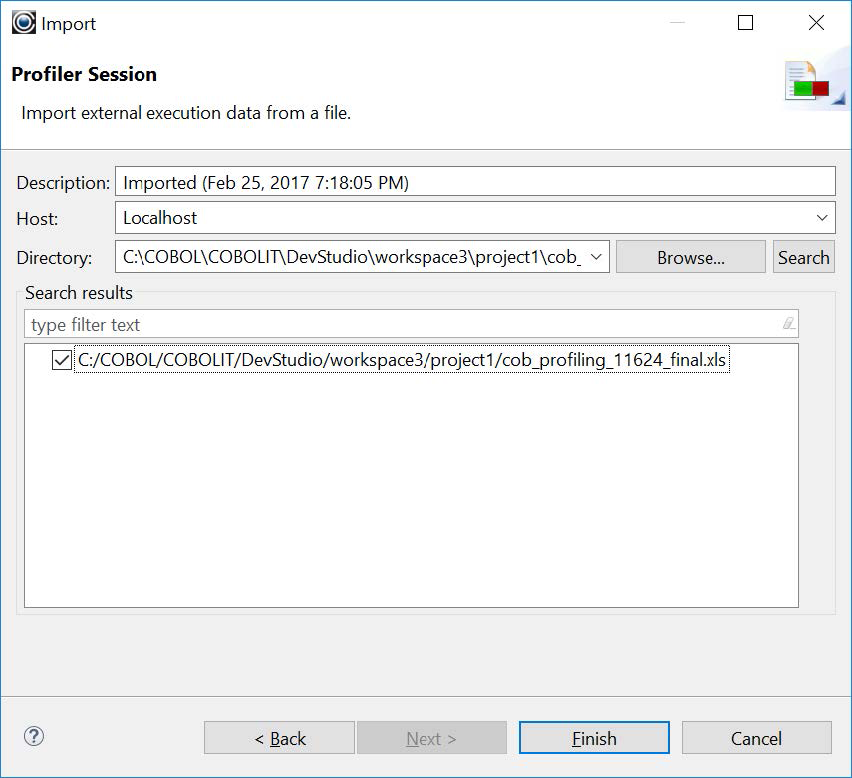
Click Finish to import the data from the Profiler Session. This data will be displayed in the Paragraphs Tab of the Profiler View, with a notation that the session was imported, and when it was imported.
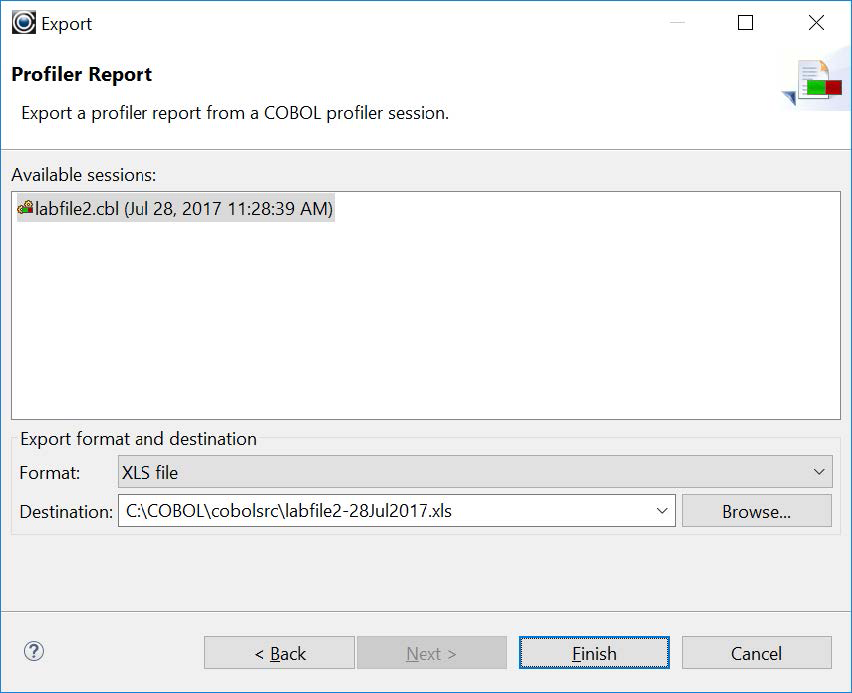
Profiler Session Export
Profiling sessions that have been generated from within the Developer Studio can be exported to a location of your choice.
To export a Code Coverage session, select the File>Export function from the Main Menubar. On the subsequent Export screen, select Profiler Report from among the available COBOL export wizards.
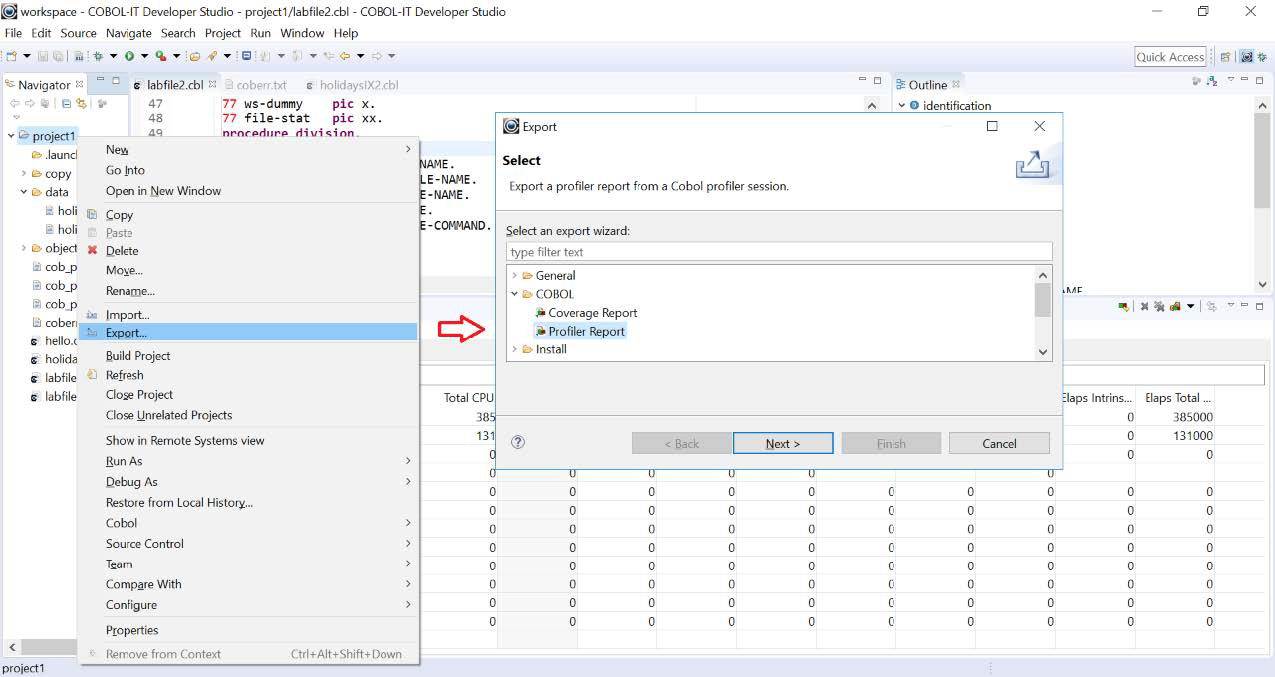
Click on the Next button to open the Export dialog window. Then click on Finish to export the profiler report to the Export destination.