The Views in the COBOL-IT Debugger Perspective
The functionality of the COBOL-IT Debugger Perspective is presented through the View interfaces. A quick overview of the main Views in the COBOL-IT Debugger Perspective is instructive:
| Debugger Perspective View | Functionality |
|---|---|
| The Debug View | A view of the stack executing in the Debugger. |
| The COBOL-IT Program View | A COBOL-IT Code Editor which is animated during debugging. |
| The Variable View | Working-Storage, Linkage Section, File Section can be expanded to see values. |
| The Breakpoints View | Lists status of all breakpoints. |
| The Expressions View | Lists all Watches that have been set. |
| The Outline View | An Outline of the active source file. |
| The Console View | Consoles include the COBOL-IT Compiler, runtime, and debugger consoles. |
| The Tasks View | Provides an interface for tracking tasks. |
| The Problems View | Provides a clickable interface for locating compiler errors in source code. |
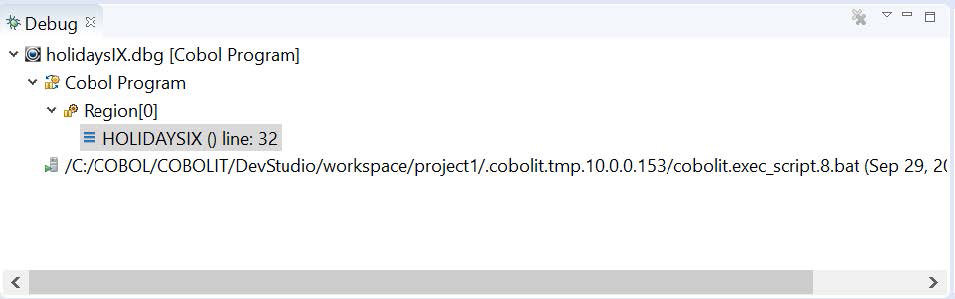
The Debug View
The Debug View shows a stack view of the execution of your program. In the graphic below, you can see the the program is currently executing at line 32 in the the program HOLIDAYSIX.
The Debug view toolbar
The functions that are presented on the Debug View toolbar help manage the visual display of the call stack in the View, and the commands used to navigate inside a debugging session.
| Debug View Function | Icon | Hotkey | Usage |
|---|---|---|---|
| Remove all terminated launches | Clears terminated launches from the Debug View. | ||
| Connect to a process | Initiates a Remote Debugging session. | ||
| Resume | F8 | Resumes the execution of the program. | |
| Suspend | Suspends execution of the program, and re-enters the debugger. | ||
| Terminate | Ctrl + F2 | Terminates the currently running process. | |
| Disconnect | Terminates a Remote Debugging session. | ||
| Step Into | F5 | The Step Into function single steps through lines of code. The Step Into function enters paragraphs/subprograms that are the targets of PERFORM/CALL statements. |
|
| Step Over |  |
F6 | The Step Over Into function causes paragraphs/subprograms that are the targets of PERFORM/CALL statements to be executed, and then Steps to the next line of code. |
| Step Return | F7 | The Step Return function causes code in a paragraph/section/subprogram to be executed, and then Steps to the next line of code after the parent PERFORM/CALL statement. |
|
| Drop to Frame | Not Supported in the COBOL-IT Debugger Perspective. | ||
| Instruction Stepping Mode | Not Supported in the COBOL-IT Debugger Perspective. | ||
| Use Step Filters | Not Supported in the COBOL-IT Debugger Perspective. | ||
| View Menu | Drops down a view of Menu options |
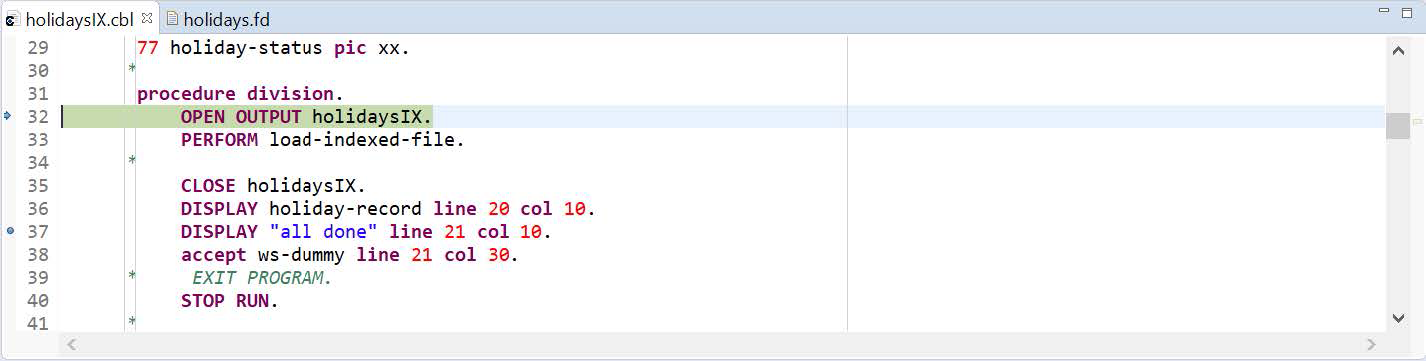
The COBOL-IT Program View
The COBOL-IT Program View is a COBOL Code Editor that is responsive to the commands described in the Debug View. In the graphic below, note the arrow ![]() positioned on line 32. This marks the line of code that the debugger will execute next. Note also the circle
positioned on line 32. This marks the line of code that the debugger will execute next. Note also the circle ![]() positioned on line 37. This marks a breakpoint, that is set within the source code.
positioned on line 37. This marks a breakpoint, that is set within the source code.
The COBOL-IT Program View Toolbar 
The functions that are presented on the COBOL-IT Program View toolbar allow the user to either Minimize or Maximize the Code Editor Window.
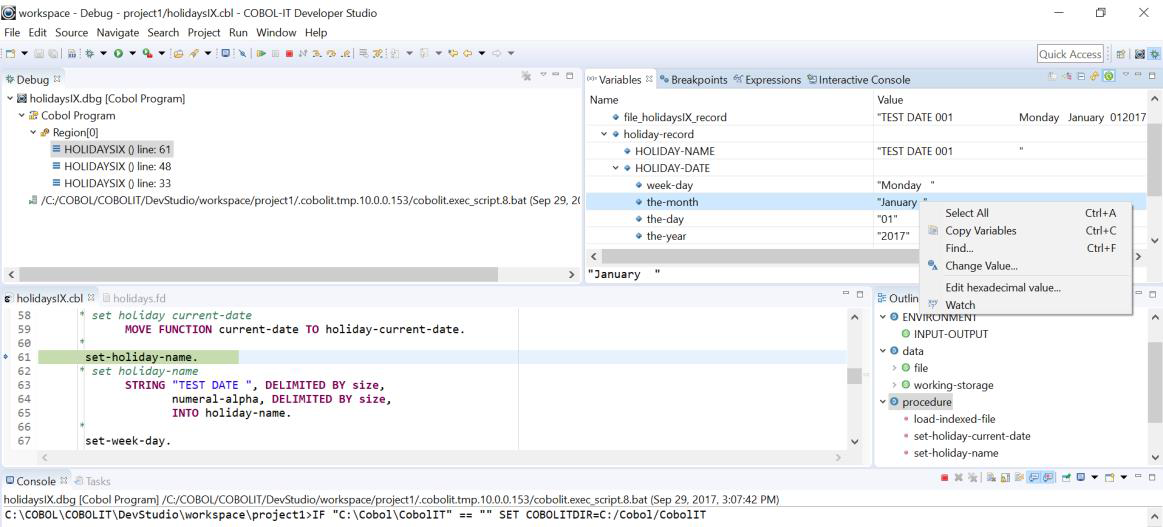
The Variable View
The Variable View provides a graphical user interface in which the variables/values of the File Section, Working-Storage Section, and Linkage Section are displayed. The right-click drop-down menu from a selected Variable in the Variable View provides:
| Option | Behavior |
|---|---|
| Select All Ctrl + A | Select all variables and copy to clipboard |
| Copy Variables | Select one or more variables and copy to clipboard |
| Find... | Search for a variable name in the Variable View |
| Change Value... | Modify the value (Ascii) of a variable |
| Edit hexadecimal value… | Modify the value (Hexadecimal) of a variable |
| Watch | Copy a variable into the Expressions View |
The Variable View Toolbar
The functions that are presented on the Variable View toolbar allow the user to expand/collapse groups of variables. Options exist for Auto-Refresh and Manual Refresh of variable values.
| Variable View Function | Icon | Hotkey | Usage |
|---|---|---|---|
| Show Type Names | Not Supported in the COBOL-IT Debugger Perspective | ||
| Show Logical Structure | COBOL data items are all presented in their logical structures, and can be expanded and collapsed. | ||
| Collapse All | Ctrl + Shift + Numpad - Divide | ||
| Refresh | Manual Refresh function. In programs with large numbers of variables, avoids degradation of performance associated with Auto-Refresh. | ||
| Auto Refresh | Auto-Refresh function. Working Storage, File Section, and Linkage Section are auto-refreshed in real time, while debugging the program. | ||
| Add Global Variables | Not Supported in the Debugger Perspective. | ||
| Remove Selected Global Variables | Not Supported in the Debugger Perspective. | ||
| Remove All Global Variables | Not Supported in the Debugger Perspective. | ||
| View Menu | Drops down a view of Menu options |
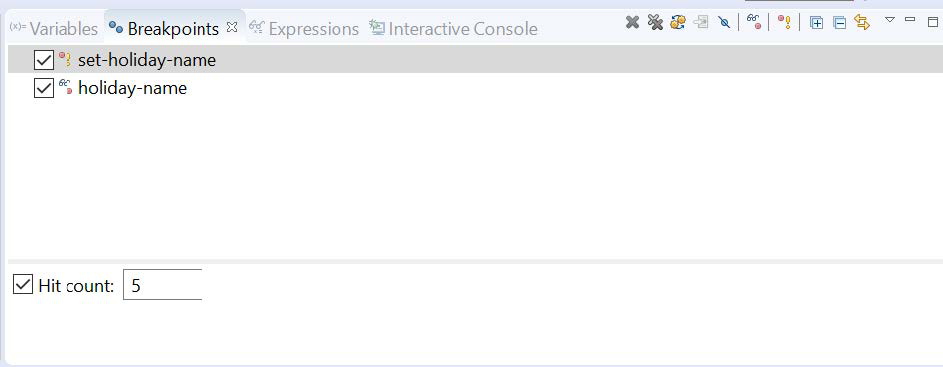
The Breakpoints View
The Breakpoints View is a single interface for managing all of the breakpoints in all of the programs that you have open in the Debugger Perspective. Breakpoints can be set at line numbers, on labels, or on variable value change.
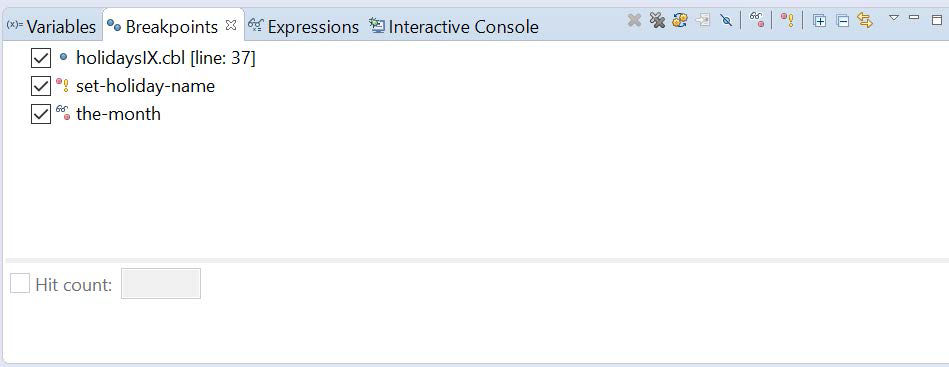
Hit Count
When you create a breakpoint, you can assign a Hit Count for it. A Hit Count is a number. If you set the Hit Count for a breakpoint to 5, for example, then the breakpoint will occur after the condition has been hit 5 times.
The Breakpoints View Toolbar
The functions that are presented on the Breakpoints View toolbar allow the user to manage breakpoints.
| Breakpoint View Function | Icon | Hotkey | Usage |
|---|---|---|---|
| Remove Selected Breakpoints |  |
Removes breakpoints that have been selected by clicking in the checkbox in the left-most column. | |
| Remove All Breakpoints |  |
Removes all breakpoints. | |
| Show Breakpoints Supported by Selected Target | Shows all breakpoints set in the COBOL programs. | ||
| Go To File for Breakpoints | Transfer focus to file at Breakpoint | ||
| Skip All Breakpoints | Disable ( but do not remove ) all breakpoints. | ||
| Expand All | Not Supported in the COBOL-IT Debugger Perspective. | ||
| Collapse All | Not Supported in the COBOL-IT Debugger Perspective. | ||
| Link With Debug View | Not Supported in the COBOL-IT Debugger Perspective. | ||
| View Menu | Drops down a view of Menu options. |
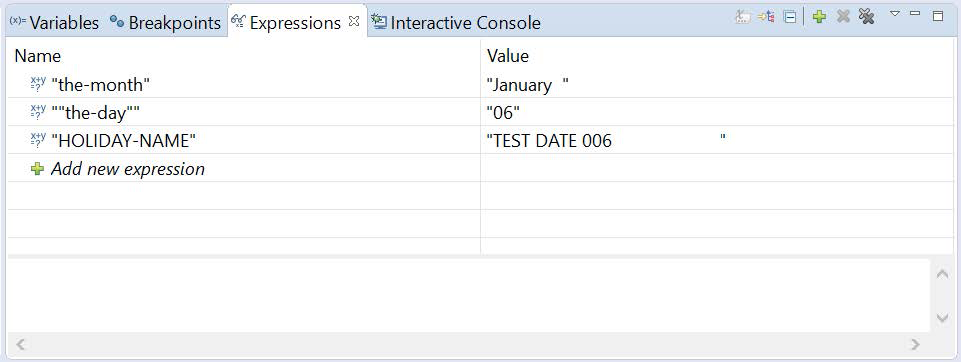
The Expressions View
The Expressions View is an interface for managing a select number of variables. If you wish to have an auto-update capability of just a small number of variables, and the performance penalty of running the debugger with Auto-Refresh on for all variables is too high, you can use the Expressions View to minimize the number of variables on Auto-Refresh.
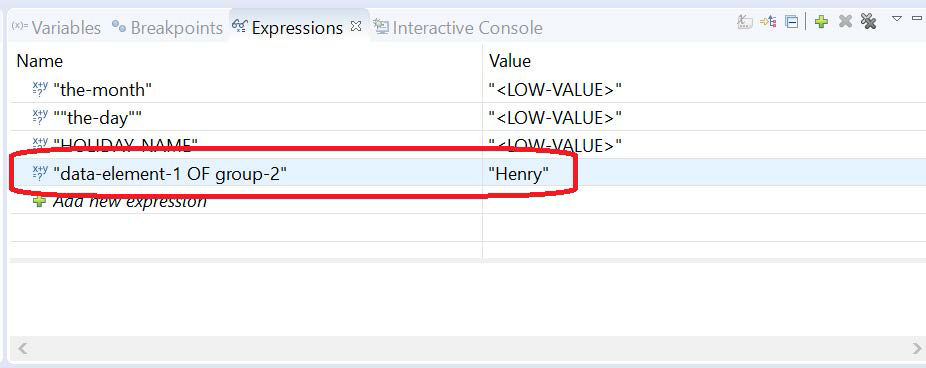
Qualified names in the Expression View
The debugger supports qualified names, such as data-element-1 in group-2 in the Expression View. Navigate to a qualified description of the data item in the source code, right-click and select Watch from the dropdown menu.
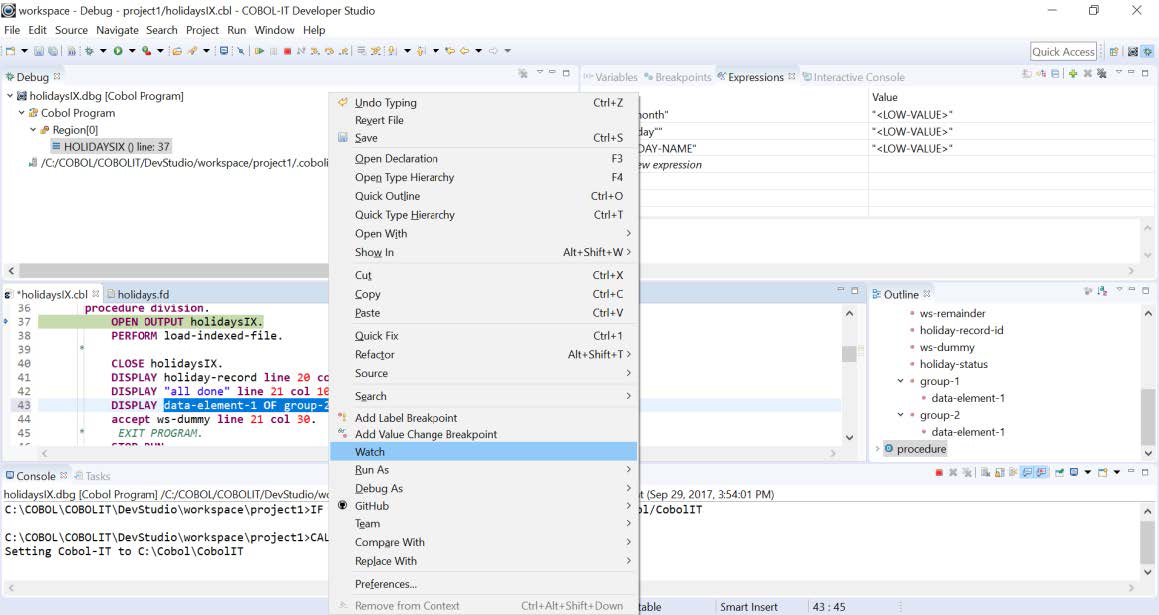
The qualified data item is copied to the Expression View.
The Expressions View Toolbar
The functions that are presented on the Expressions View toolbar allow the user to manage Expressions. Expressions can be created, collapsed, expanded, and removed.
| Expression View Function | Icon | Hotkey | Usage |
|---|---|---|---|
| Show Type Names | Not Supported in the COBOL-IT Debugger Perspective. | ||
| Show Logical Structure | COBOL data items are all presented in their logical structures, and can be expanded and collapsed. | ||
| Collapse All | Ctrl + Shift + Numpad - Divide | Collapses all structures. | |
| Create a new Watch Expression | Opens dialog window in which a new Watch Expression can be described. Note that Watch Expressions can also be added from within the Variable View, by right-clicking on a variable, and selecting Watch from the dropdown menu. | ||
| Remove Selected Expressions |  |
Removes expressions that have been selected by clicking on them. | |
| Remove All Expressions | Removes all expressions listed in the Expressions View. | ||
| View Menu | Drops down a view of Menu options. |
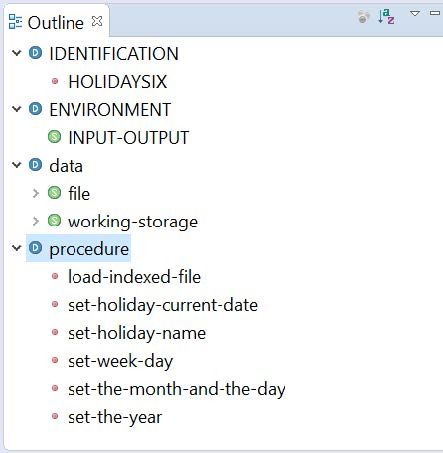
The Outline View
The Outline View is an interface for viewing the source file in Outline form. The Outline View is linked to the COBOL-IT Program View, as clicking on any of the entries in the Outline View highlights the corresponding line of code in the COBOL source file.
The Outline View Toolbar
The Outline View Toolbar contains an Alphabetic Sort function.
| Outline View Function | Icon | Hotkey | Usage |
|---|---|---|---|
| Focus on Active Task | Not Supported in the COBOL-IT Debugger Perspective. | ||
| Sort | Sorts the Outline view alphabetically. | ||
| View Menu | Drops down a view of Menu options |
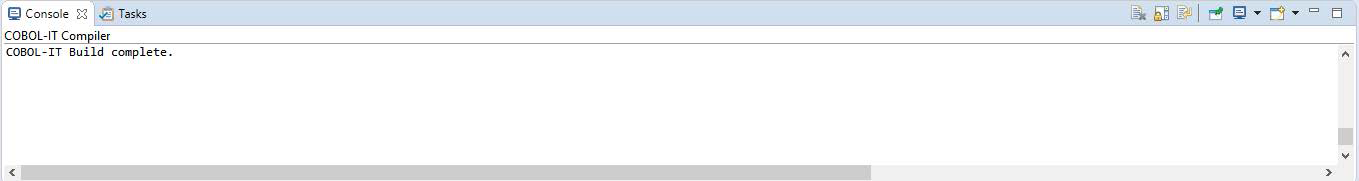
The Console View
The COBOL-IT Compiler Console View allows you to view the output of the compiler command that has been executed.
The Console View Toolbar
The Console View Toolbar allows you to manage the selection of open consoles, and provides the ability to clear the console.
| Console View Function | Icon | Hotkey | Usage |
|---|---|---|---|
| Clear Console | Clears all text from the open console window. | ||
| Scroll Lock | Not Supported in the COBOL-IT Debugger Perspective. | ||
| Pin Console | Not Supported in the COBOL-IT Debugger Perspective. | ||
| Display Selected Console | Allows selection of a console from a dropdown list to be the active console in the output window. For example, select the COBOL-IT Compiler console to see output from the Compiler on Build operations. | ||
| Open Console | Adds a new console to the Display Selected Console dropdown list of available consoles. |
The Tasks View
The Tasks View toolbar provides access to the Mylyn Task Manager. For details on how to use the Task Manager, see Using Mylyn for Task Management section in the Getting Started with the Developer Studio - The Utilities document.
The Tasks View Toolbar
| Tasks View Function | Icon | Hotkey | Usage |
|---|---|---|---|
| Focus on Active Task | Places focus in active source file. | ||
| View Menu | Drops down a view of Menu options. |
The Problems View
The Problems View provides a clickable interface for returning from reported compiler errors to their location in the source file.
The Problems View Toolbar
| Problems View Function | Icon | Hotkey | Usage |
|---|---|---|---|
| Focus on Active Task | Places focus in active source file. | ||
| View Menu | Drops down a view of Menu options. |