Attaching the Debugger to a Running Process
Is it possible to attach the COBOL-IT Debugger to a program, or subprogram that is running, at a selected place in the program or subprogram?
C$DEBUG is a library routine which can be called using either the PID of the runtime session, or the value of the environment variable COB_DEBUG_ID. Prior to calling C$DEBUG, the program should acquire the value of the PID/COB_DEBUG_ID.
You may acquire the value of the PID of the runtime session by calling the C$PID library routine, using a PIC 9(n) parameter. The parameter must be numeric, and large enough to hold the value of the Process ID.
For example:
       77 ws-pid PIC 9(5).
       …..
       CALL « C$PID » USING ws-pid.
       CALL « C$DEBUG » USING ws-pid.
You may also call C$DEBUG using the value of the runtime environment variable COB_DEBUG_ID. Using the runtime environment variable COB_DEBUG_ID to hold the value of this parameter has an advantage if you prefer to set the value of the parameter yourself. Acquire the value of COB_DEBUG_ID programmatically before calling the C$DEBUG library routine. The parameter must be numeric, and large enough to hold the value of the value of the runtime environment variable COB_DEBUG_ID.
For example:
       77 ws-did PIC 9(5).
       …..
       ACCEPT ws-did FROM ENVIRONMENT « COB_DEBUG_ID ».
       CALL «C$DEBUG » USING ws-did.
After a call to C$DEBUG is made, the executing program, or subprogram is paused. In this state, the COBOL-IT Debugger may be attached to this runtime process from the COBOL-IT Developer Studio.
Key concepts
In order to attach to the COBOL-IT Debugger, the program containing the call to C$DEBUG library routine must be compiled with –g.
The COBOL-IT Developer Studio will request the location of the source file associated with the program/subprogram that has been paused by the C$DEBUG command, for purposes of debugging.
The COBOL-IT Developer Studio attaching to the paused runtime session requires a COBOL Project, and requires that some configuration is preset. Recommended settings are:
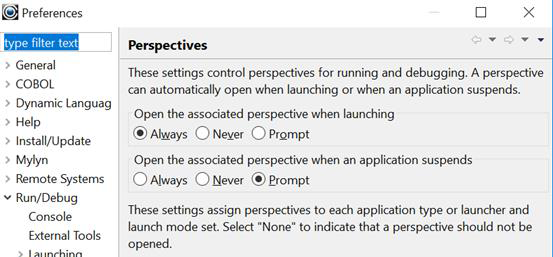
In Window>Preferences>Run/Debug>Perspectives, set Open the associated perspective when launching to Always.
In our example, we have a program, debugid.cbl, which calls a subprogram, subpgm.cbl, which retrieves the PID of the runtime session, and then calls C$DEBUG to pause the runtime session.
We will run these programs from a batch file, as follows:
Launch, and Pause the Runtime using CALL « C$DEBUG »
runit.bat
SET COB_LIBRARY_PATH=.\object
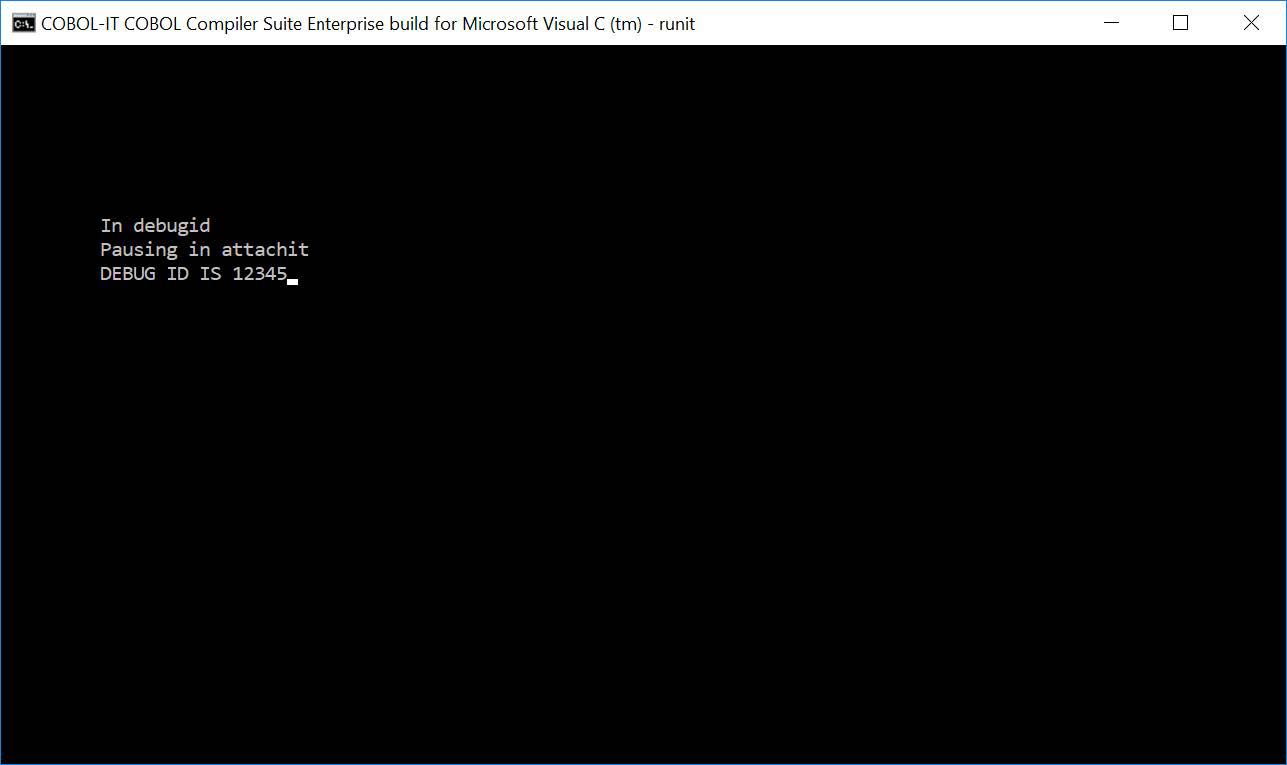
cobcrun debugid
This will return the screen below. Note that in your case, the Process ID will likely be different.
Attach the Debugger from the Developer Studio
The Developer Studio must be configured to enter the Debugger Perspective when launching the debugger. In Window>Preferences>Run/Debug>Perspectives, set Open the associated perspective when launching to Always.
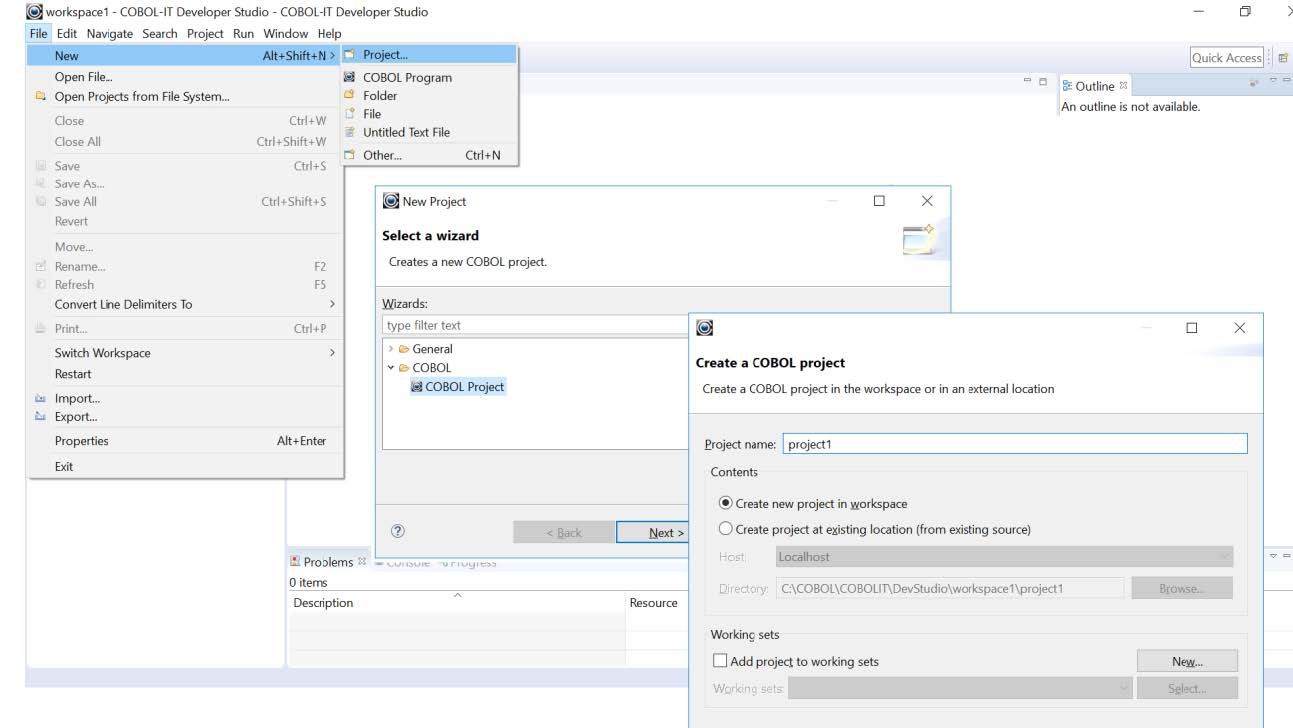
Create a New COBOL Project
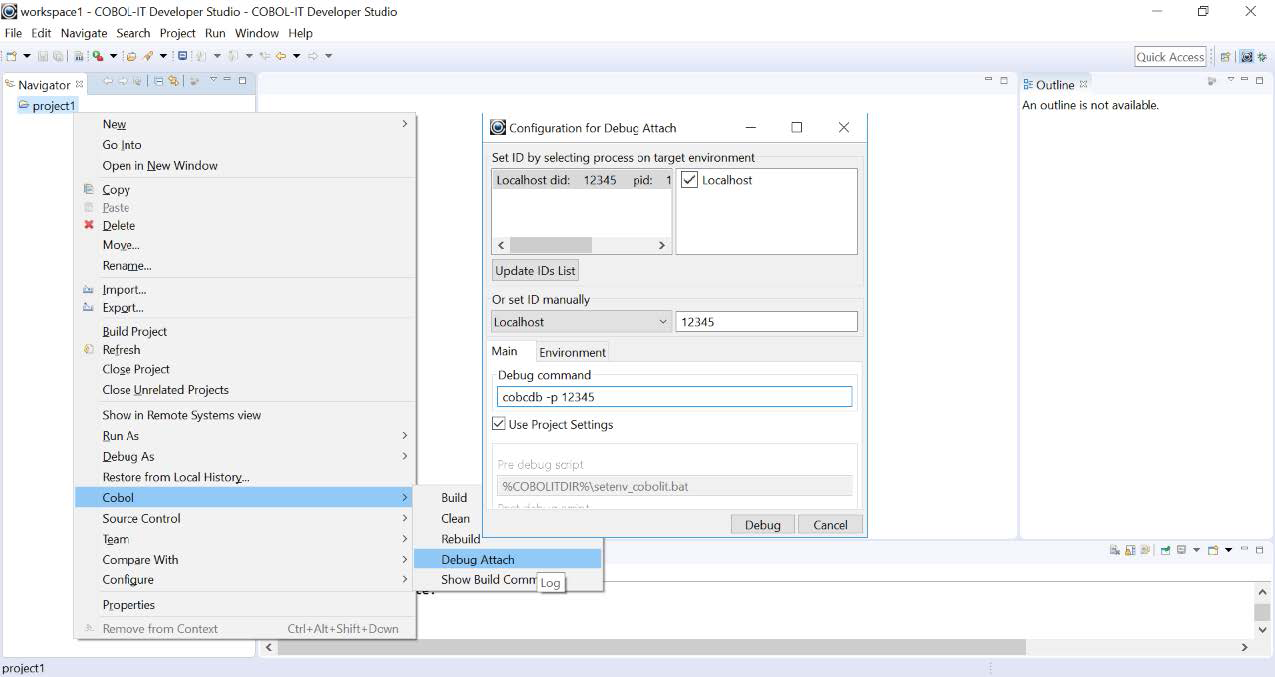
Select Debug Attach Function
In the Navigator Window, right-click on the Project, and select COBOL>Debug Attach from the dropdown list. In the Debug Configuration for Reverse Attach Window, select the entry with the PID that matches the PID of the paused runtime session. Click Debug.
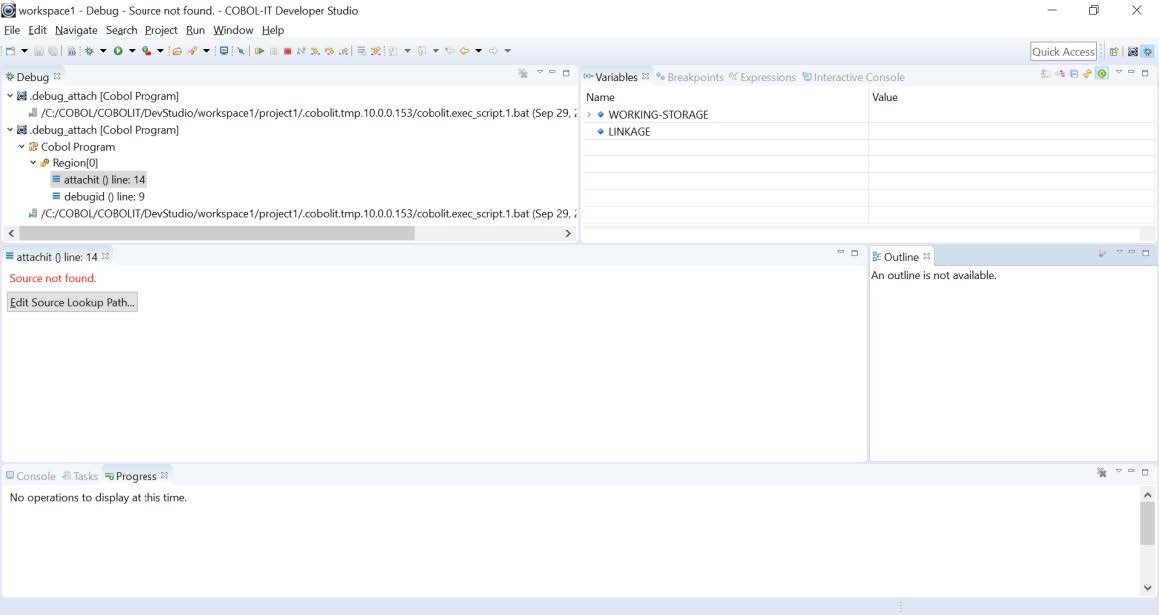
Edit Source Lookup Path
The Developer Studio opens in the Debugger Perspective. Note that there is a message, in red, that Source Not Found. To associate the the source code of subpgm.cbl with the project, click on the Edit Source Lookup Path… button.
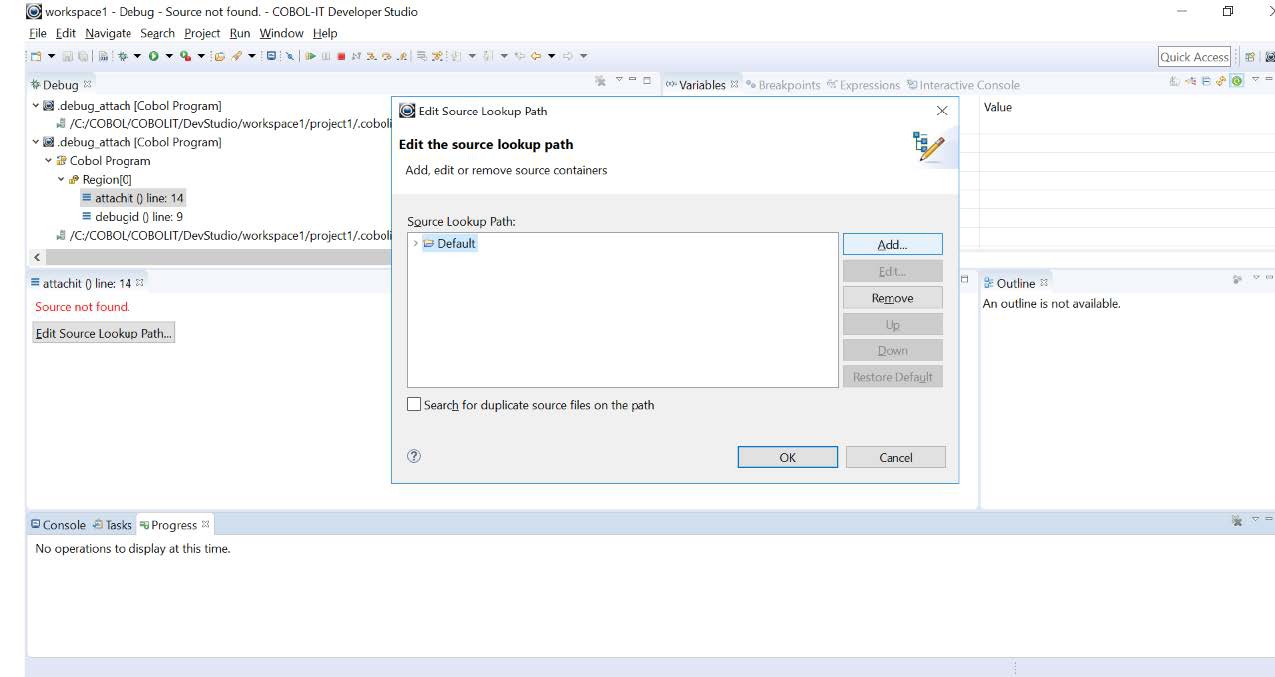
On the Edit the Source Lookup Path Screen, the Default setting is your current Project Path. If the source files are not in your Project Path (they probably are not), click the Add button.
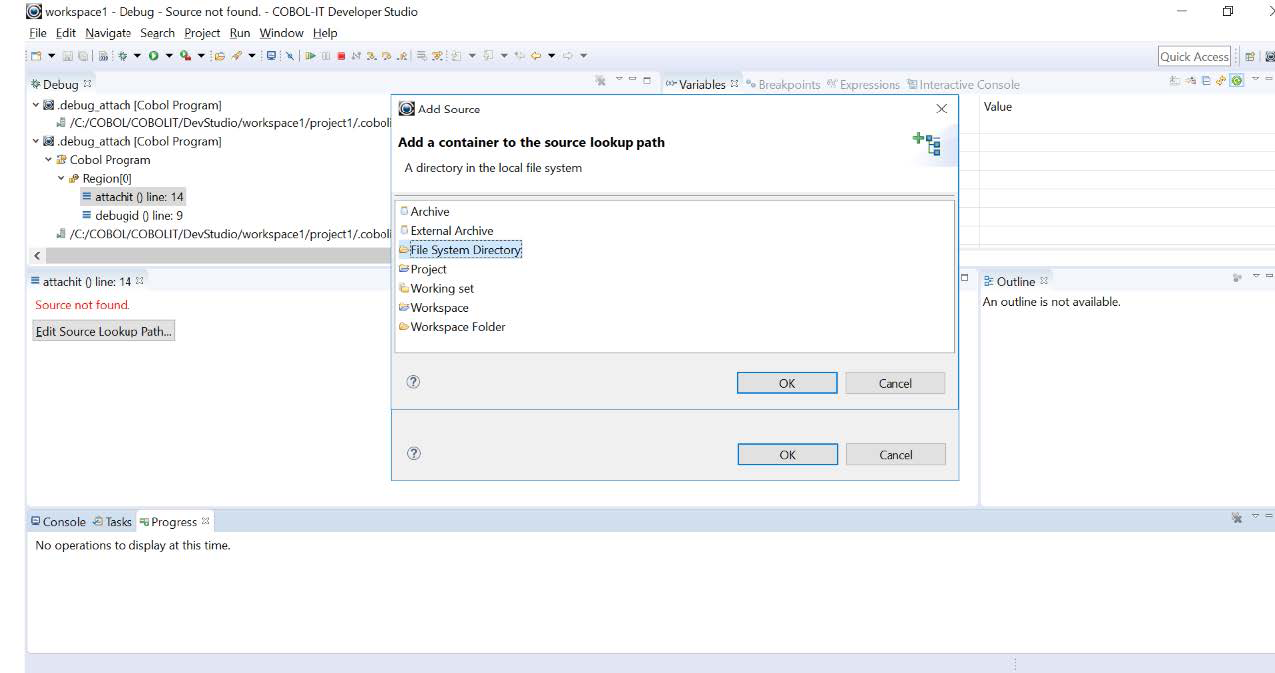
After clicking the Add button, select File System Directory and click OK.
Use the Browse button to locate the Source Location.
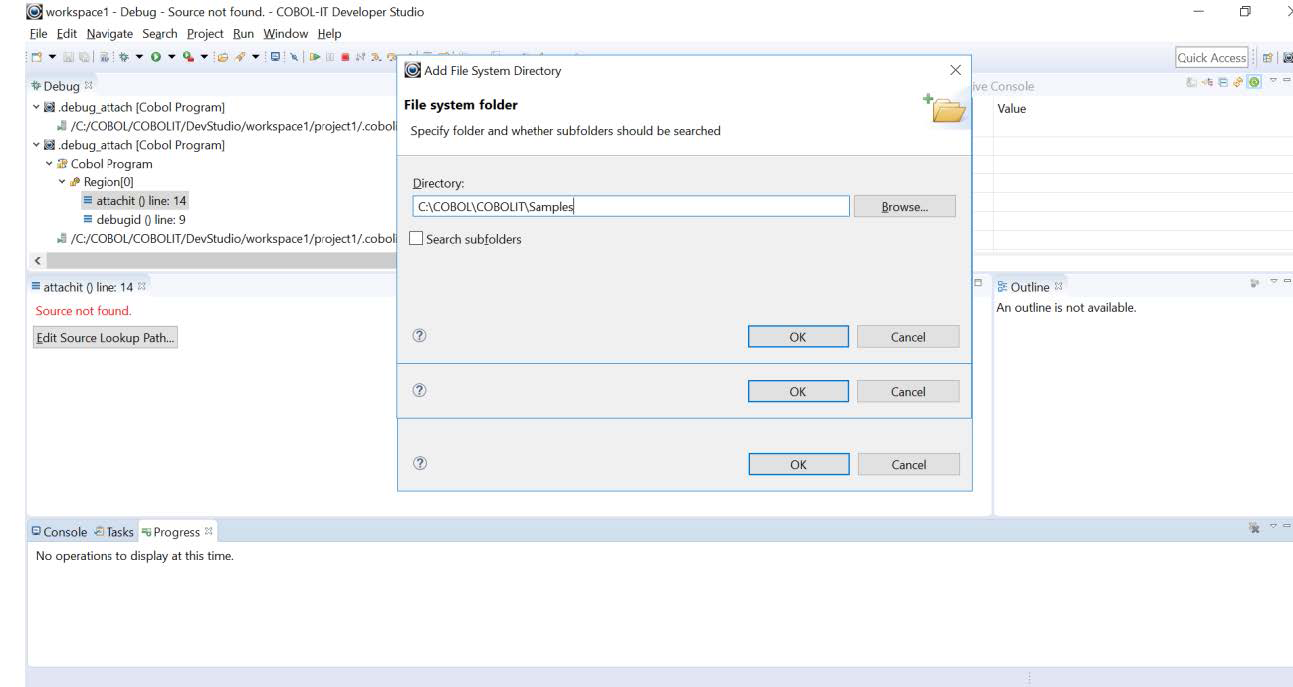
Your selection will appear in the Edit Source Lookup Path Window. Click OK.
Debug in the Developer Studio
You are now ready to debug in the Developer Studio:
Use the Debugger toolbar buttons to debug your program.
Disconnecting the Debugger
You may wish to disconnect the debugger and continue running your program.
To disconnect the debugger, select the highest level of your session in the Debugging View, titled .debug-attach. This will enable the Disconnect toolbar button to the right of the Terminate button. Click on the Disconnect button to disconnect the COBOL debugger without terminating the runtime session.
Programs used in this sample
debugid.cbl
       identification division.
       program-id.   debugid.
       environment division.
       data division.
       working-storage section.
       procedure division.
       main.
              display "In debugid" line 8 col 10.
              call "attachit".
              display "Back in debugid" line 12 col 10.
              stop run.
attachit.cbl
       identification division.
       program-id.   attachit.
       environment division.
       data division.
       working-storage section.
       77 ws-pid     pic 9(5).
       procedure division.
       main.
              display "Pausing in attachit" line 9 col 10.
              ACCEPT ws-pid from environment "COB_DEBUG_ID".
      *       CALL "C$PID" using ws-pid.
              DISPLAY "DEBUG ID IS " ws-pid line 10 col 10.
              CALL "C$DEBUG" using ws-pid.
              DISPLAY "Carry on in the debugger" line 11 col 10.
              EXIT PROGRAM.
runit.bat
SET COB_DEBUG_ID=12345
SET COB_LIBRARY_PATH=C:\COBOL\COBOLIT\Samples
cobc -g debugid.cbl
cobc -g attachit.cbl
cobcrun debugid