Important Debugging Operations
Opening the Debugger Perspective
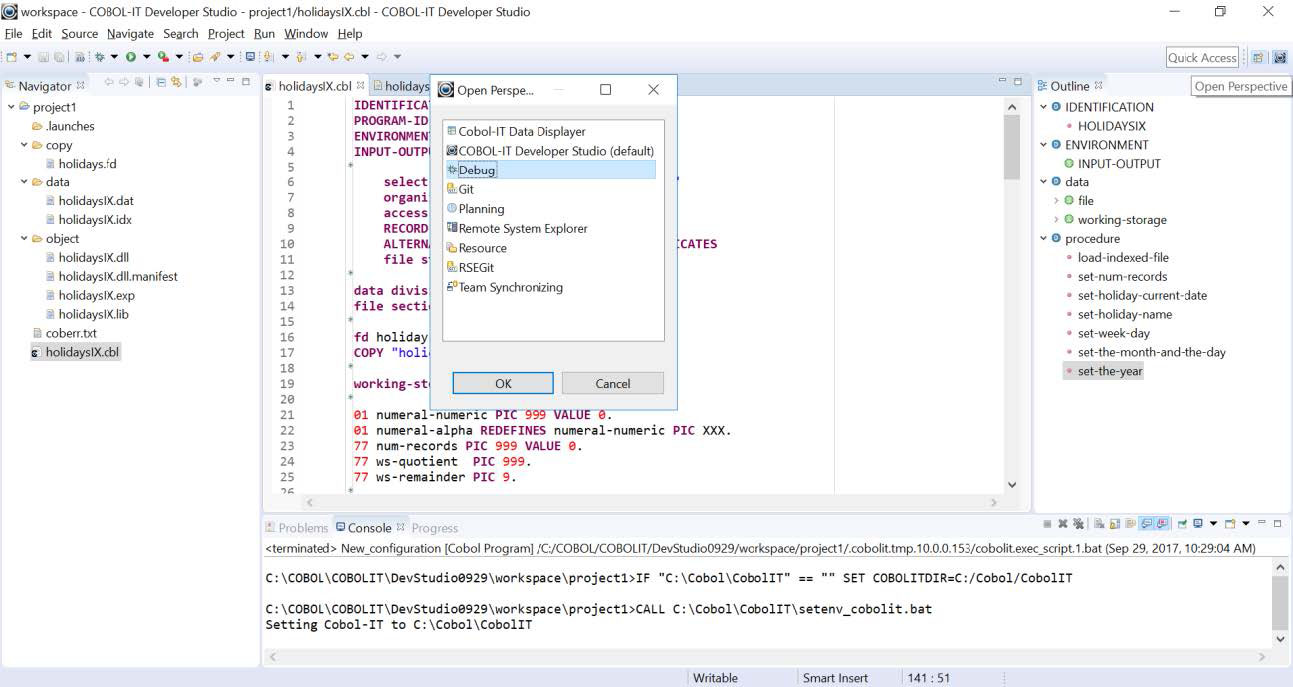
Open Perspectives Tab
The Debugger Perspective can be opened through the Open Perspectives dialog Window.
Click on the Open Perspectives button in the upper-right corner of the Developer Studio, select Other…, and then click on COBOL-IT Debugger in the Open Perspective Window. This opens the Debugger Perspective directly.
Click the Debug button, or press Fn+F11
Select a source file that has been set up in the project, and click the Debug toolbar button, or press Fn + F11.
Note
By default, the Debug function is associated with the F11 key in the Window>Preferences>General>Keys interface, as described in the Configuration section.
The Debug function uses the default compiler flags associated with the program to compile it if a Build is required, and then uses the runtime configuration described for the program to set the appropriate environment variables. Clicking the Debug button or pressing Fn + F11 then will initiate the execution of the selected program in the Debugger Perspective.
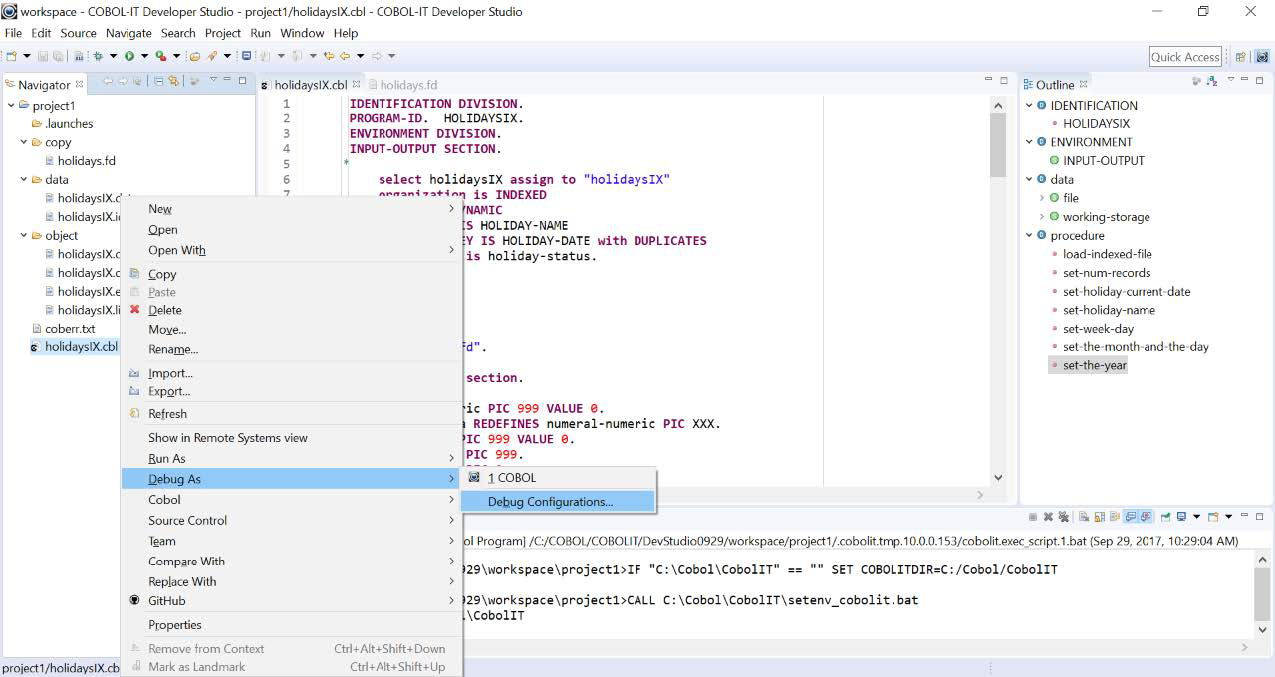
Use the Debug As function
The Debug As function is similar to the Run As function. A Debug Configuration can be configured to contain environment variables needed for debugging purposes.
We name our new Debug Configuration holidaysIX.dbg and associate our new Debug Configuration with the program holidaysIX.cbl.
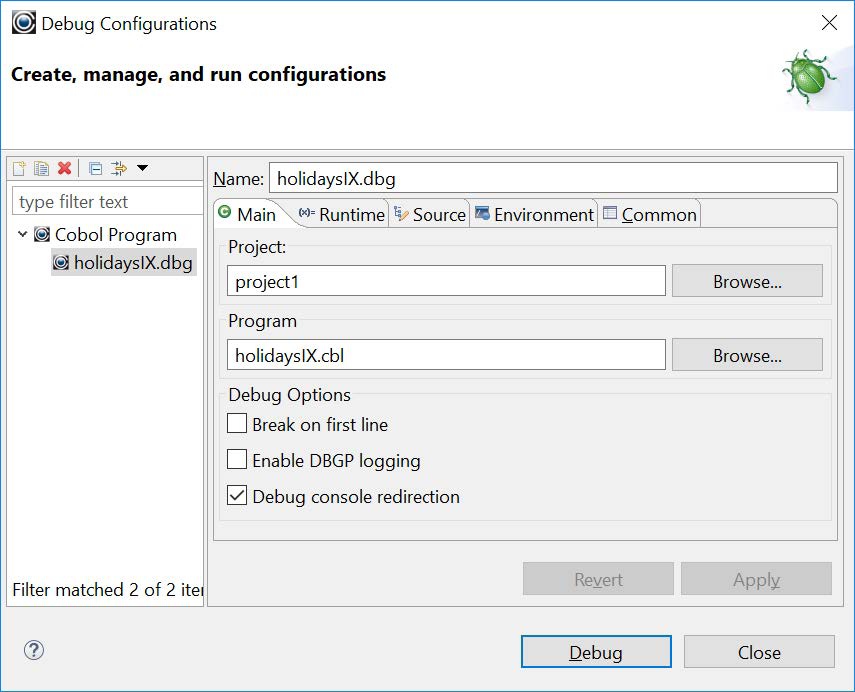
The Runtime tab contains default runtime settings. No changes are necessary.
The Source tab is useful if the debugger needs to locate your source file. No changes are necessary.
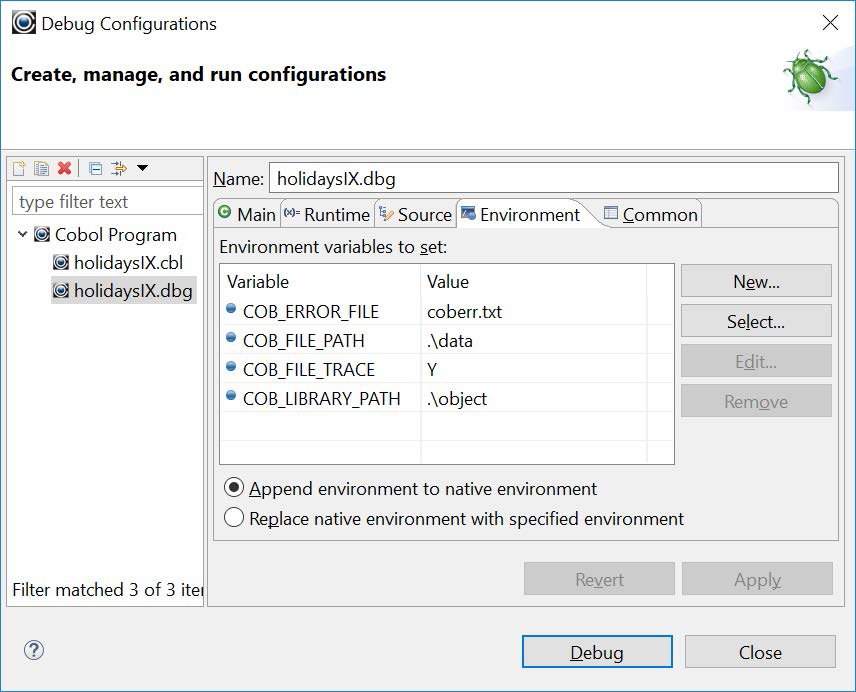
The Environment tab allows you to set runtime environment variables that are only useful in debugging situations. In the case below, we can see that COB_FILE_TRACE is set to Y, for example. To use this debug configuration, click Apply, and then click Debug.
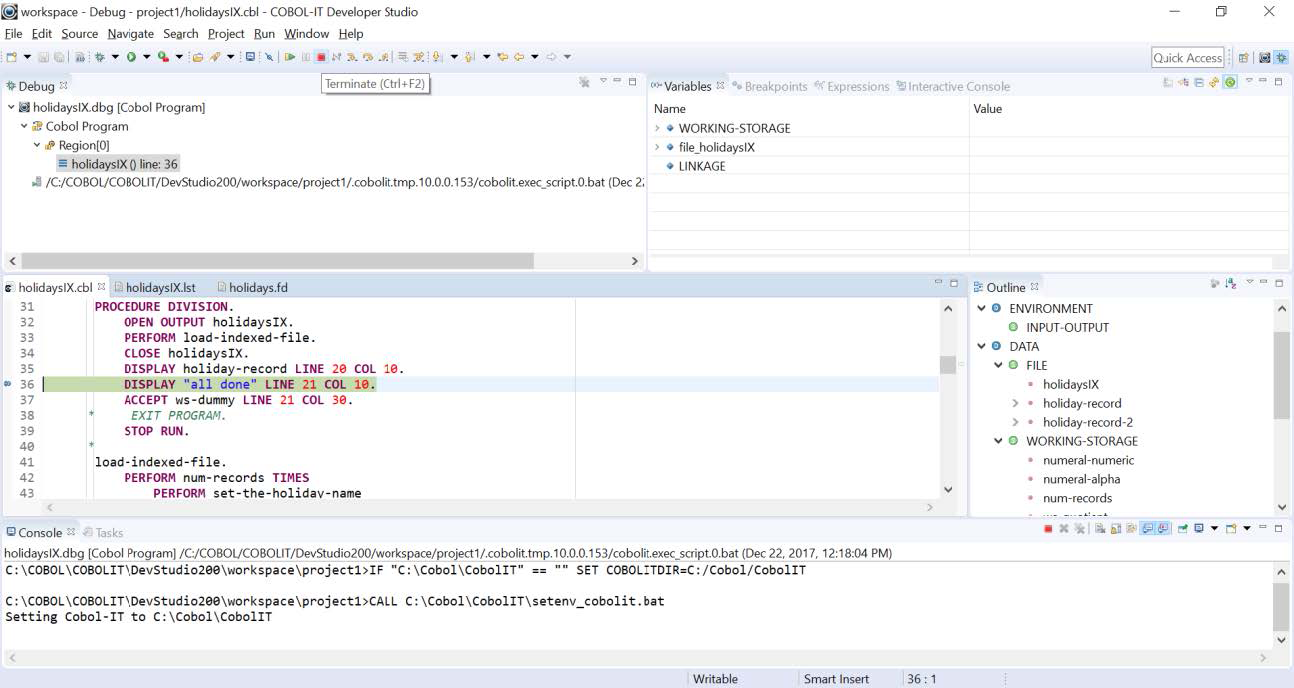
The Debug View
In the image below:
![]()
holidaysIX.dbg is the name of the debug configuration
![]() COBOL Program is the class of program running
COBOL Program is the class of program running
![]()
Region(0) is the first thread running in the Program
![]()
HOLIDAYSIX () line 32 represents the compiled object/current line of execution
![]()
C:/COBOL/COBOLIT…./eclipse.exec_script1.bat is the name of the batch file
executing the debugger process.
When focus is on the compiled object, as in the image above, all of the debug functions on the toolbar are enabled. In this mode, user steps/runs through the program, stopping at breakpoints. Note that the current line of execution is recorded in the Debug View Window.
Step/Run/Terminate Functions
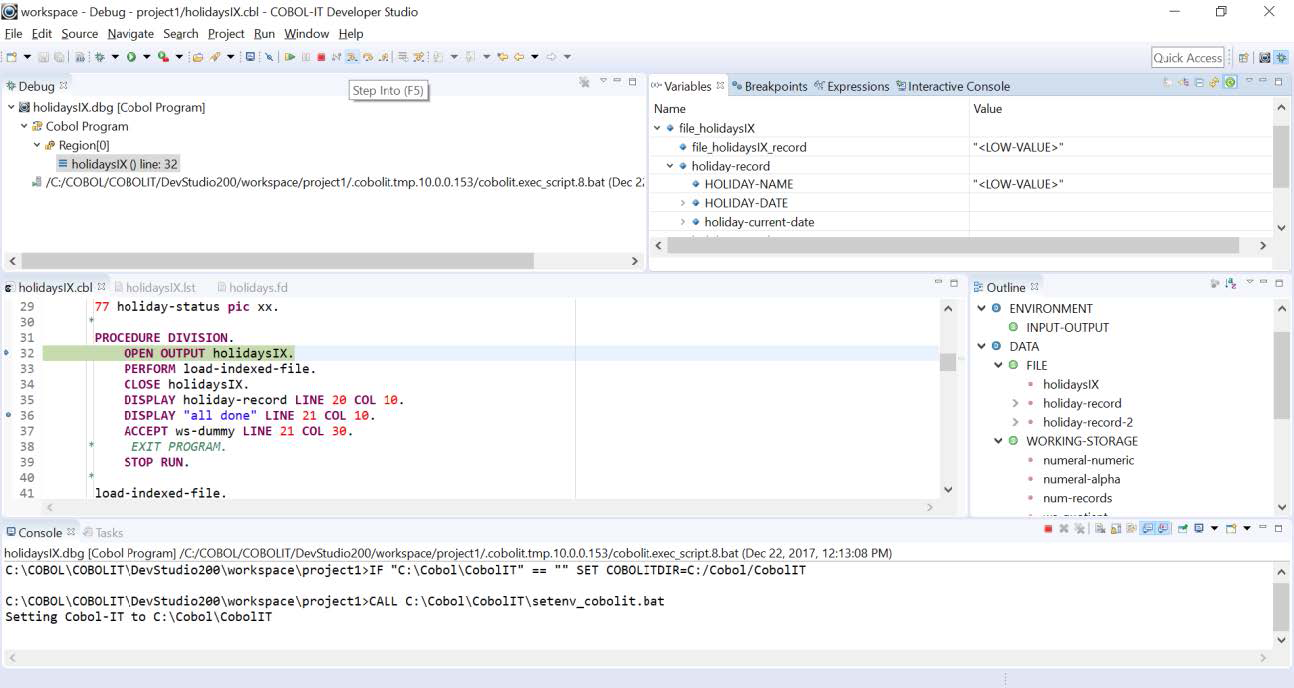
Single-Step
With the cursor positioned on a line of code, use the Single-Step/Fn + F5 function to advance to the next line of code. In this case, the cursor will then be positioned on line:
33: PERFORM load-indexed-file.
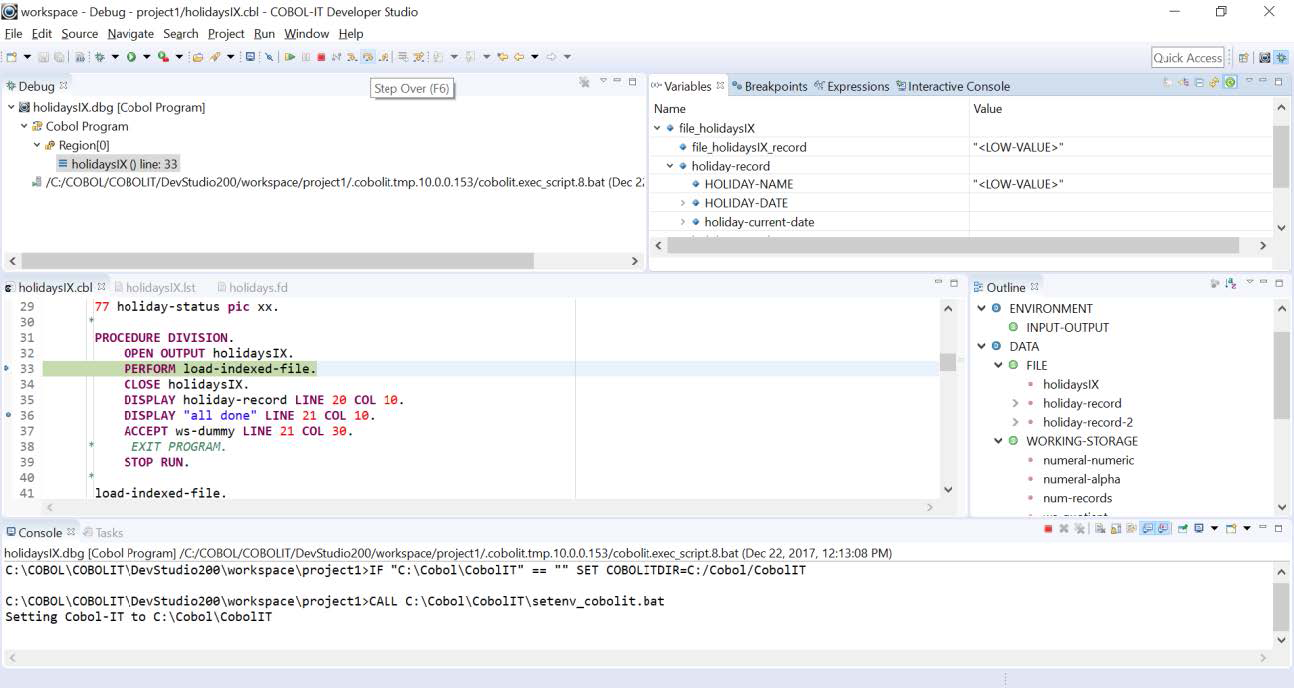
Step Over
With the cursor positioned on a PERFORM or CALL statement, use the Step Over/Fn + F6 function to cause all of the code in the target of the PERFORM/CALL to be executed, and then advance to the next line of code. In this case, the cursor will then be positioned on line:
35: CLOSE holidaysIX.
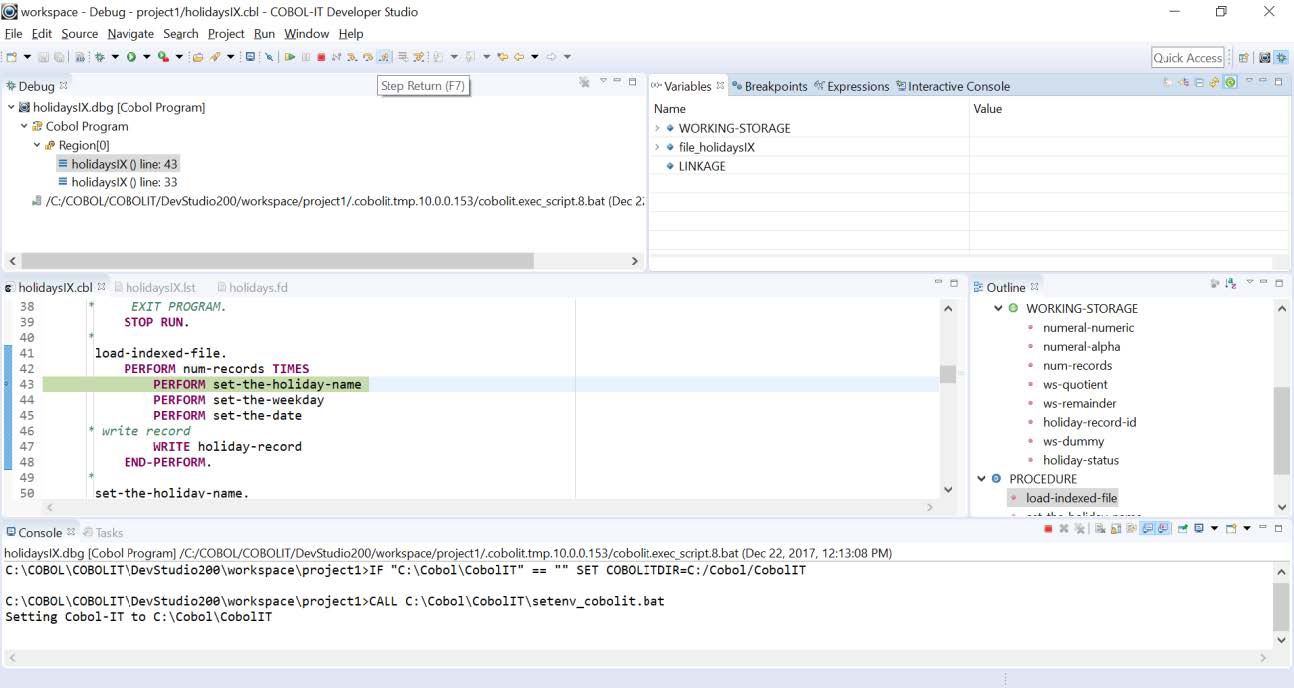
Step Return
With the cursor positioned inside the target of a PERFORM statement, on a line of code, use the Step Return/Fn + F7 function to execute the rest of the code in the target paragraph, and then advance to the next line of code. In this case, the cursor will then be positioned on line:
35: CLOSE holidaysIX.
This action of the Step Return (F7) command will pause on Format 1/Format 2 ACCEPT Statements, and will pause on breakpoints.
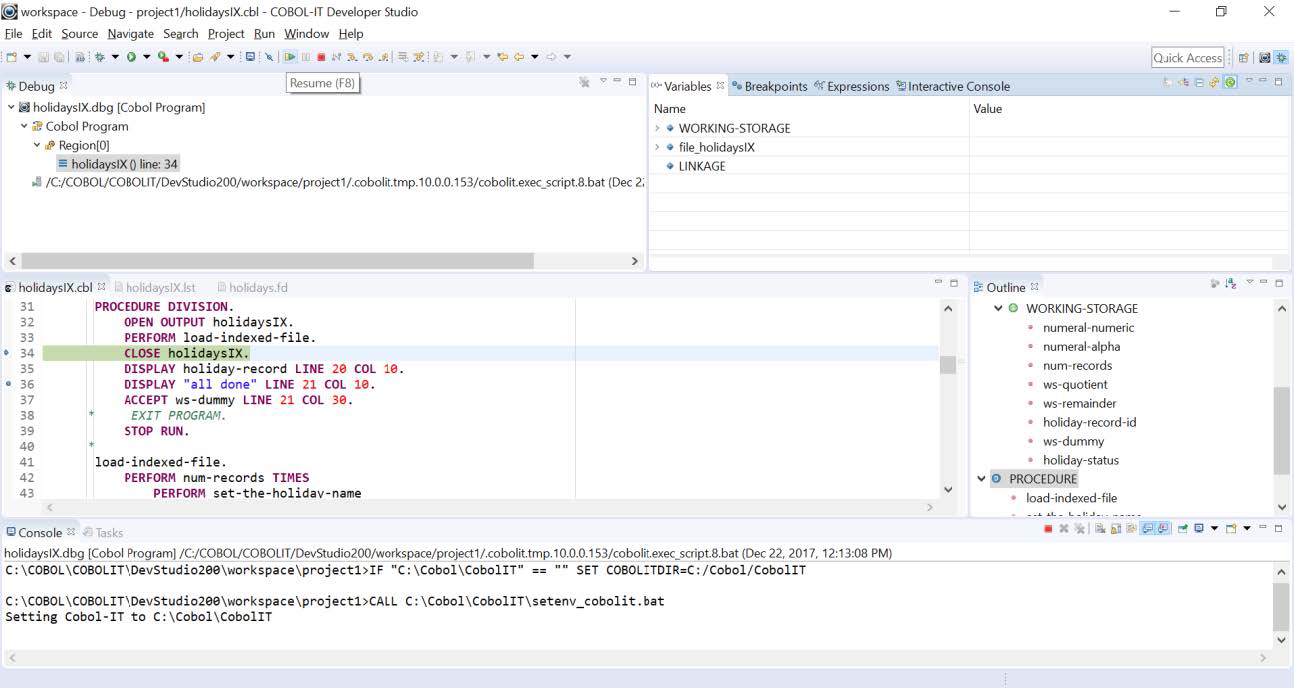
Resume
The Resume (F8) command causes the program to run normally until it reaches a breakpoint or until the program is terminated. When a breakpoint is reached, the program re-enters a debugging mode, and stepping operations can be resumed. In this case, the cursor will then be positioned at the breakpoint on line:
36: DISPLAY “all done” line 21 col 30.
Terminate
The Terminate command (Ctrl + F2) terminates debugging session, and terminates the program at the current line of execution.
The Variables View
Refreshing the Variable View
By default, the COBOL-IT Debugger Perspective is configured to Auto-Refresh the Variable view.
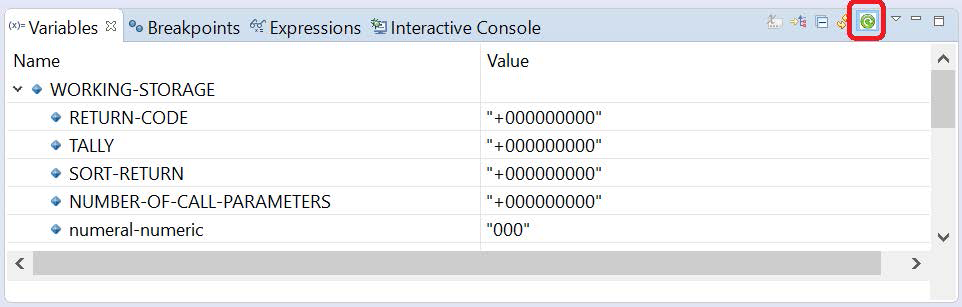
If you have a very large Working-Storage Section, this may not be desirable. Under these conditions, it could be preferable for the user to select the Manual Refresh ![]() on the Variables View toolbar, and use the Expressions View for auto-refresh of selected variables.
on the Variables View toolbar, and use the Expressions View for auto-refresh of selected variables.
Change the value of a variable
In the Variable View, you can change the value of a variable by selecting the variable in the Variable View, right-clicking, and selecting Change Value…. In the Change Value dialog screen, type over the existing value, and the Variable View will be updated with the new value. Debugging can proceed with the new variable value.
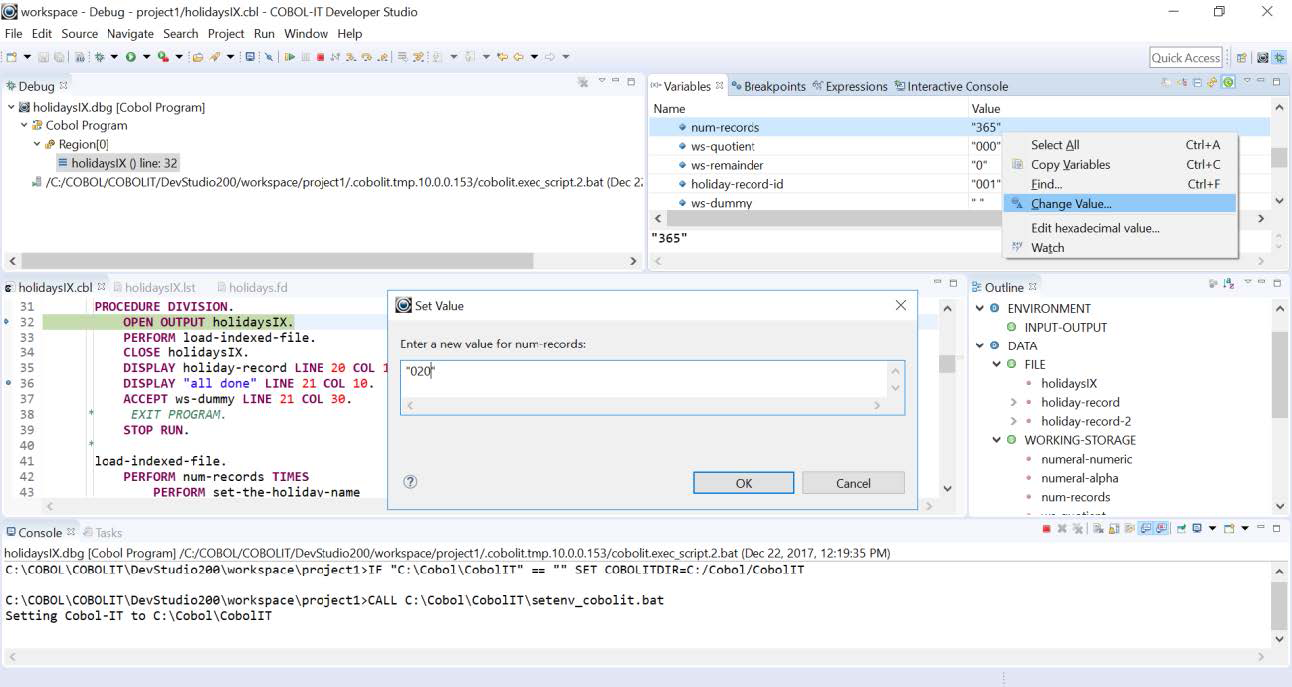
Verify that the change has been made, and continue with debugging.
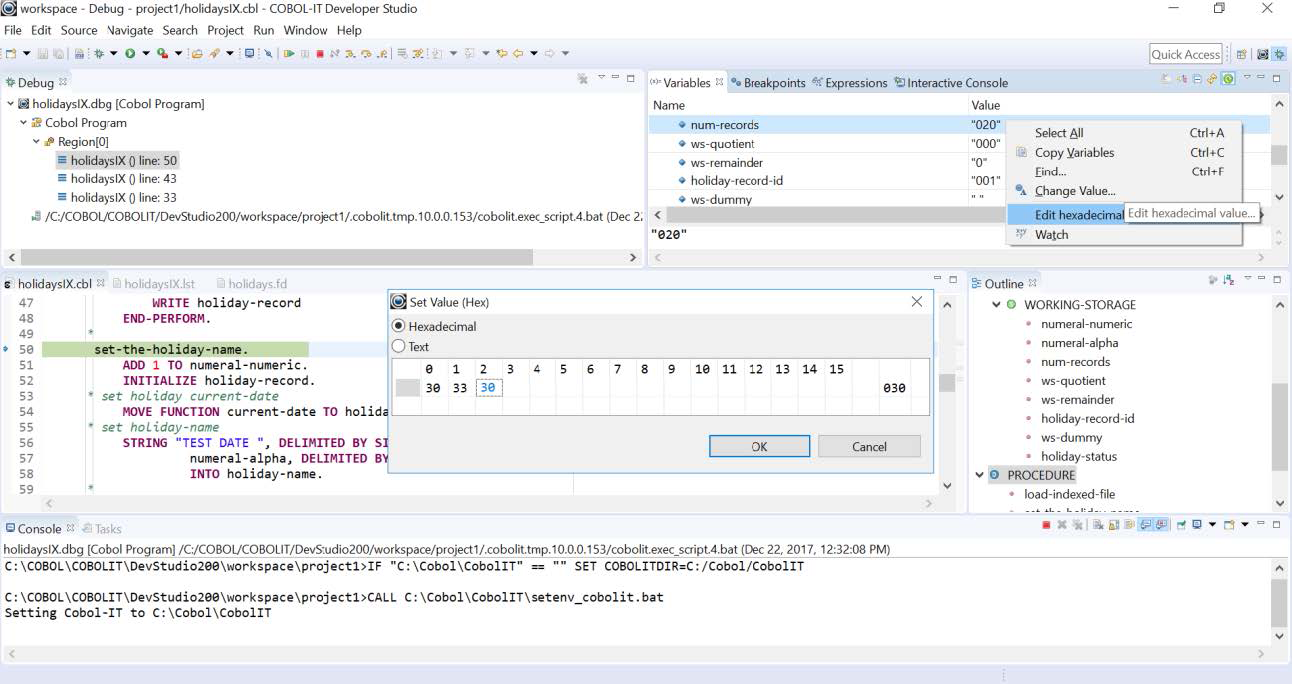
Change the hexadecimal value of a variable
The COBOL value dialog screen allows the user to set the value of a variable in either Hexadecimal or Text. In the Variable View, you can change the COBOL value of a variable by selecting the variable in the Variable View, right-clicking, and selecting Edit hexadecimal value…. The Set Value (hex) dialog screen allows you to enter a new value for the selected variable. Type over the existing value, and the Variable View will be updated with the new value. Debugging can proceed with the new variable value.
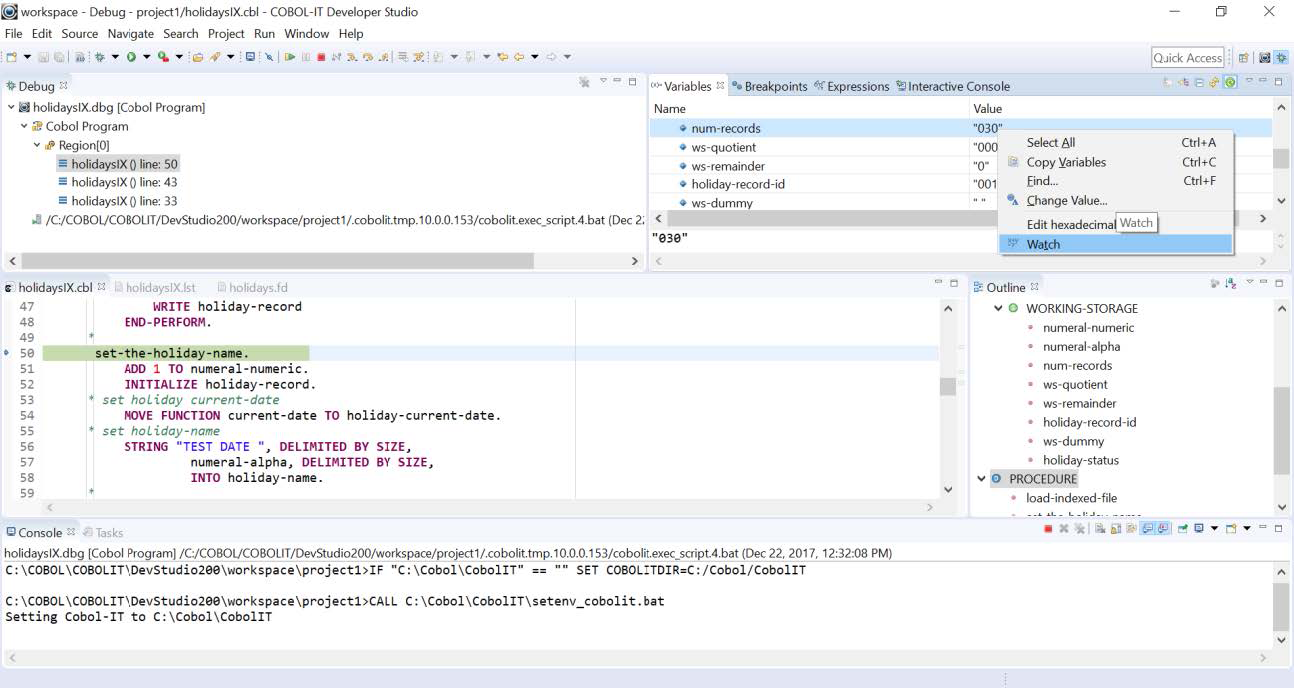
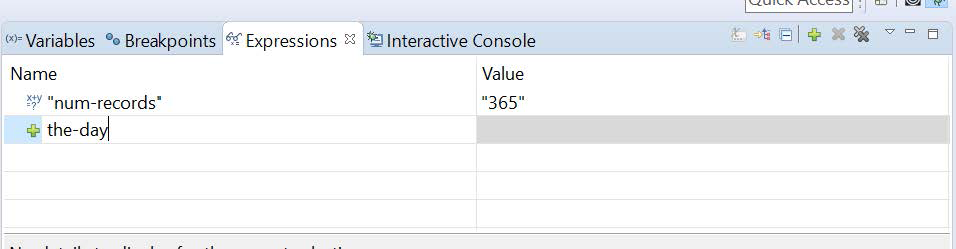
Create a Watch for a variable
You can add a variable to the Expressions View by selecting the variable in the Variable View, right-clicking, and selecting Watch…. The variable and its current value are transferred into the Expressions View Window. De-select Auto-refresh when using Expressions for best performance.
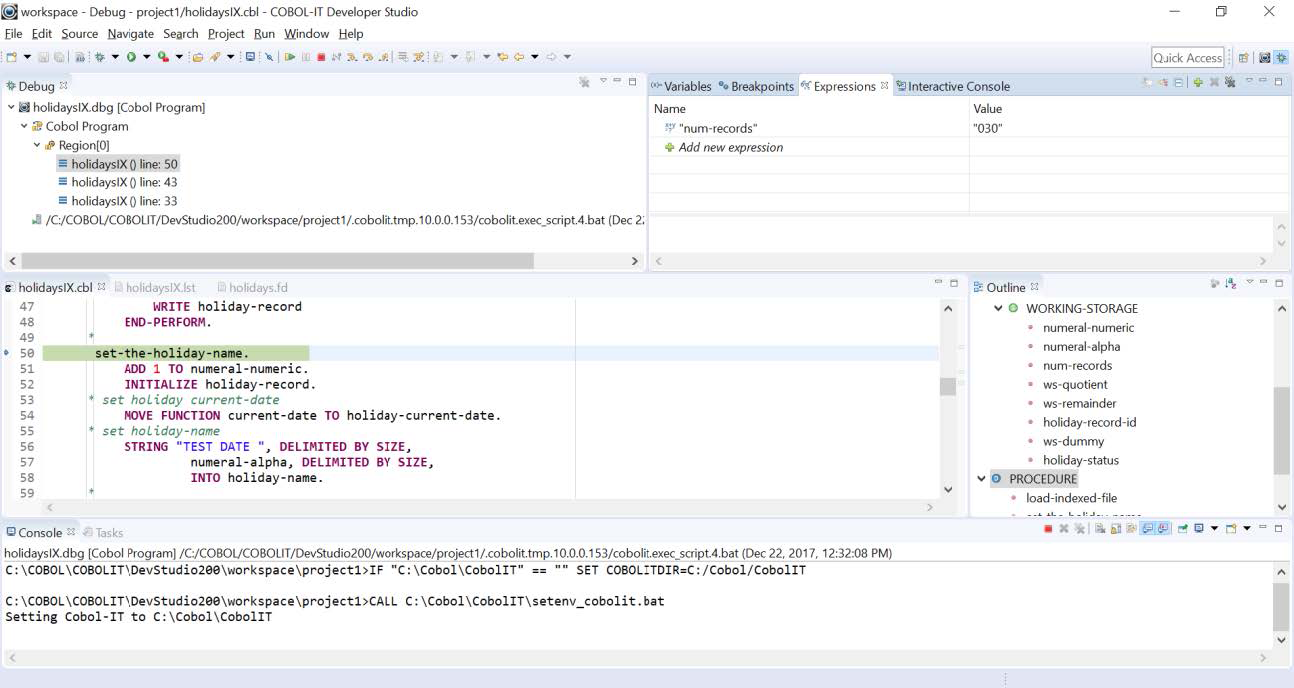
Open the Expressions View to limit the number of variables you are following.
Breakpoints
Toggle Breakpoints from within the Editor Window
You can toggle a line breakpoint (set or unset) by double-clicking in the left-most column of the Editor Window. This is the column to the left of the line-number columns, and is where the small circle that represents a breakpoint can visually be seen in your source code.
Toggle Breakpoints from within the Breakpoints View Window
When you have created a breakpoint, you will see that it has been added to the Breakpoints View window, and that the enabling checkbox is checked. To remove a breakpoint from the Breakpoints View, select the breakpoint, open the right-click dropdown menu, and select the Remove function.
Disable a breakpoint
You can Disable a breakpoint by right-clicking on the breakpoint in the COBOL-IT Program View, and selecting the Disable function, or by right-clicking on the breakpoint declaration in the Breakpoints View screen, and selecting the Disable function, or by de-selecting the breakpoint’s enabling checkbox in the Breakpoints View screen.
Note
Disabling a breakpoint is different than removing a breakpoint in that it can subsequently be enabled. You can enable a disabled breakpoint using the same right-click interfaces used to disable the breakpoint.
Skip all breakpoints
You can disable all breakpoints by clicking on the Skip All Breakpoints ![]() button on the Breakpoints View toolbar.
button on the Breakpoints View toolbar.
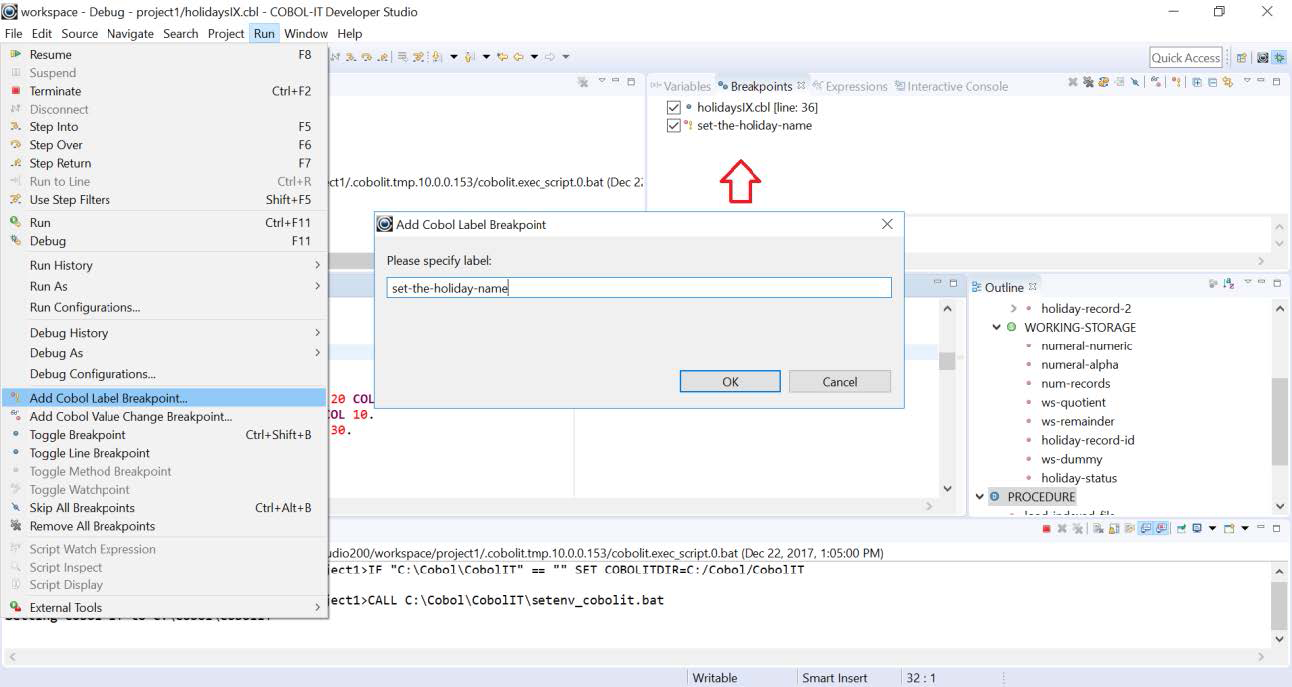
Run>Add COBOL Label Breakpoint…
Select the Run function on the main menubar, right-click, and select Add COBOL Label Breakpoint… from the dropdown menu. Enter the label name of a paragraph or section and click OK. With a COBOL Label Breakpoint, a breakpoint condition occurs every time that the label is encountered.
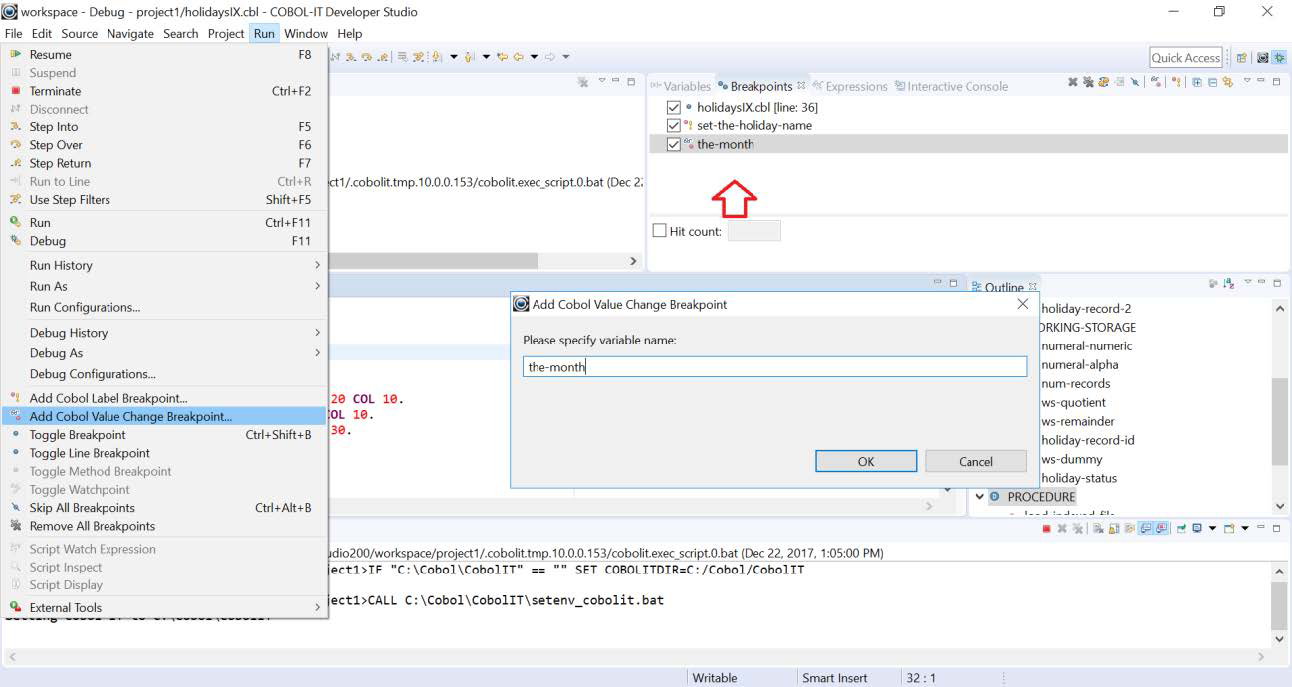
Run>Add COBOL Value Change Breakpoint
Select the Run function on the main menubar, right-click, and select Add COBOL Value Change Breakpoint… from the dropdown menu. Enter the variable name, and click OK. With a COBOL Value Change Breakpoint, a breakpoint condition occurs every time that the value of this variable changes. The COBOL Value Change Breakpoint can be used with a variable being watched in the Expressions View.
Expressions
Add a new expression
To add a new expression, you can click on the Add new expression button on the Expressions toolbar, or you can click on the in-line Add new expression function. Clicking on the inline Add new expression function allows the user to type the expression directly into the Name column.
Code Editor Functions
Show Line Numbers
You can Show or Hide Line Numbers by right-clicking in the left-most column of the Editor Window, and checking or unchecking the Show Line Numbers function.
Transferring control to console on ACCEPT
The behavior of the COBOL-IT Debugger when positioned on an ACCEPT statement is worth noting. When stepping through code, the current line is marked by an arrow in the left-most column of the current line. The source code on the line is colorized (green) before the code is executed.
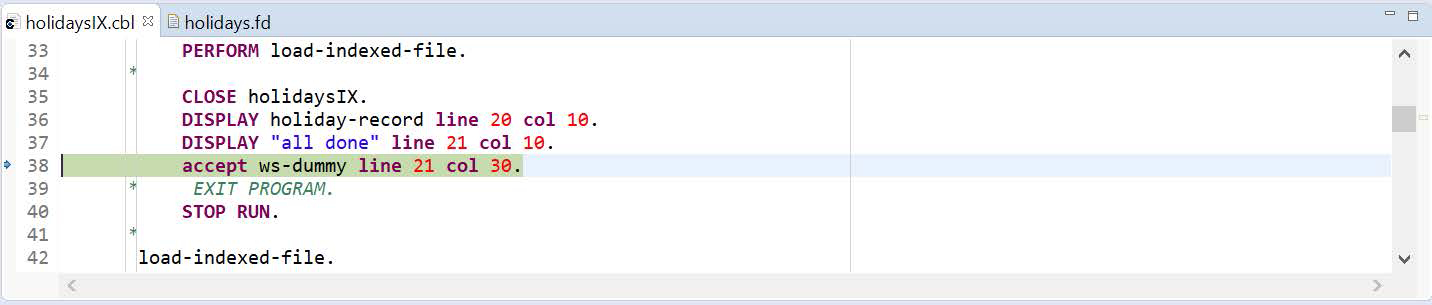
Normally, the single-step process will move this arrow, and this colorized source line by line through the code. However, in the case of the ACCEPT statement, the debugger must pause, and wait for input from the console.
In the case above, press F5 to single-step. This executes the ACCEPT statement, but does not move the line. The debugger signals the user that it is paused and waiting for input by changing the colorization of the current line. See below:
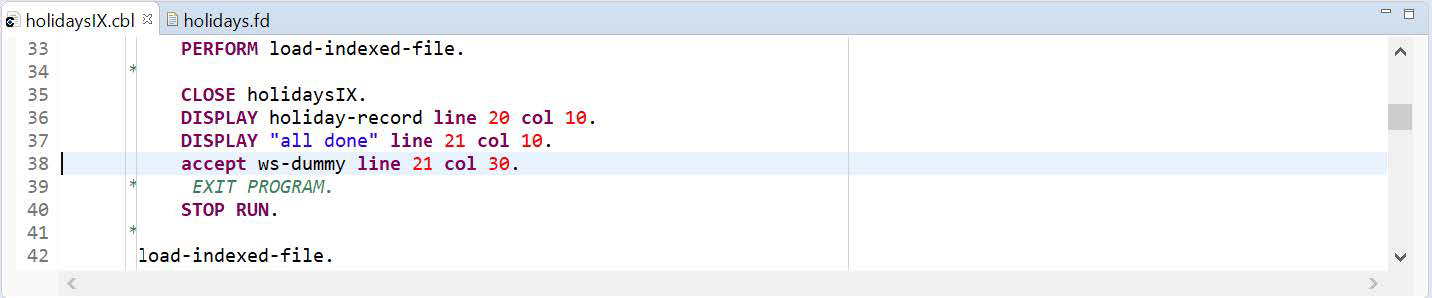
At this point, the user must raise the console, and perform the operation that terminates the ACCEPT. In this case, hit the Enter key.