Code Coverage
Code Coverage records which parts of your COBOL code are executed during a program launch. Coverage analysis is very simple:
After you have set your Project>Properties to include the code coverage compiler flags, code coverage analysis is produced automatically when you run (or run in debug) your program. The results are a Coverage analysis are presented in the Coverage View. Source Code in the COBOL Code Editor is automatically decorated to demonstrate whether lines of source were executed or missed in the run.
Quick Start Guide
Enable COBOL code coverage in Project>Properties
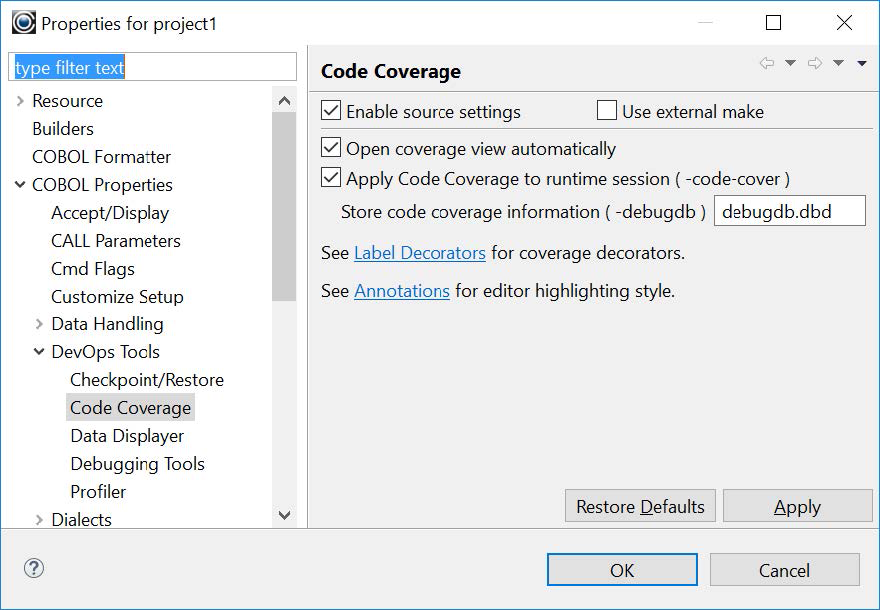
The behavior of the COBOL Code Coverage can be adjusted in the Project>Properties>COBOLProperties>DevOps Tools>Code Coverage dialog screen.
To launch coverage for a COBOL program, you must build the project using the -code-cover compiler flag, with the -debugdb compiler flag, followed by a the name of the .dbd file in which you wish to store your coverage information.
During the project build, the compiler will prepare all required metadata for coverage and store it in the debugdb.dbd file. This file is generated in the same directory as the object files. If no COB_LIBRARY_PATH is set, the .dbd file and the object files are generated in the current working directory. Otherwise the .dbd file and the object files are generated in the directory named by the COB_LIBRARY_PATH environment variable.
Build the Project
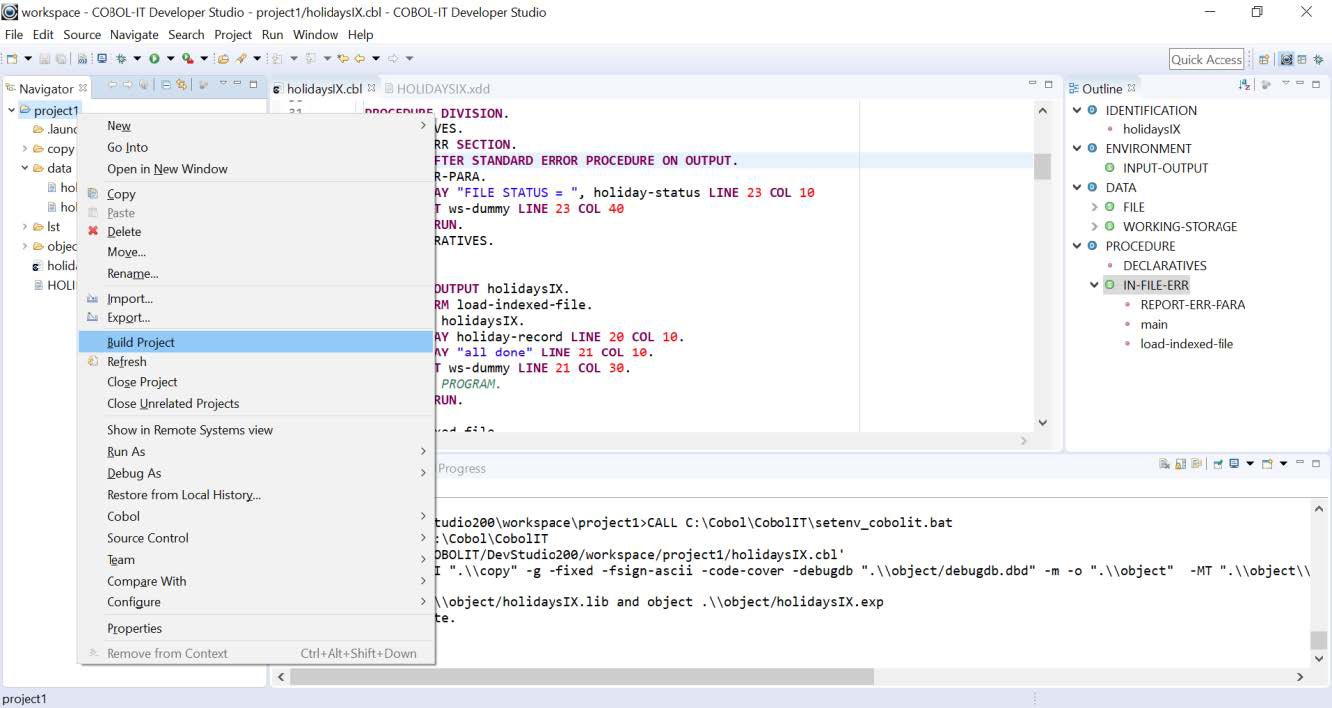
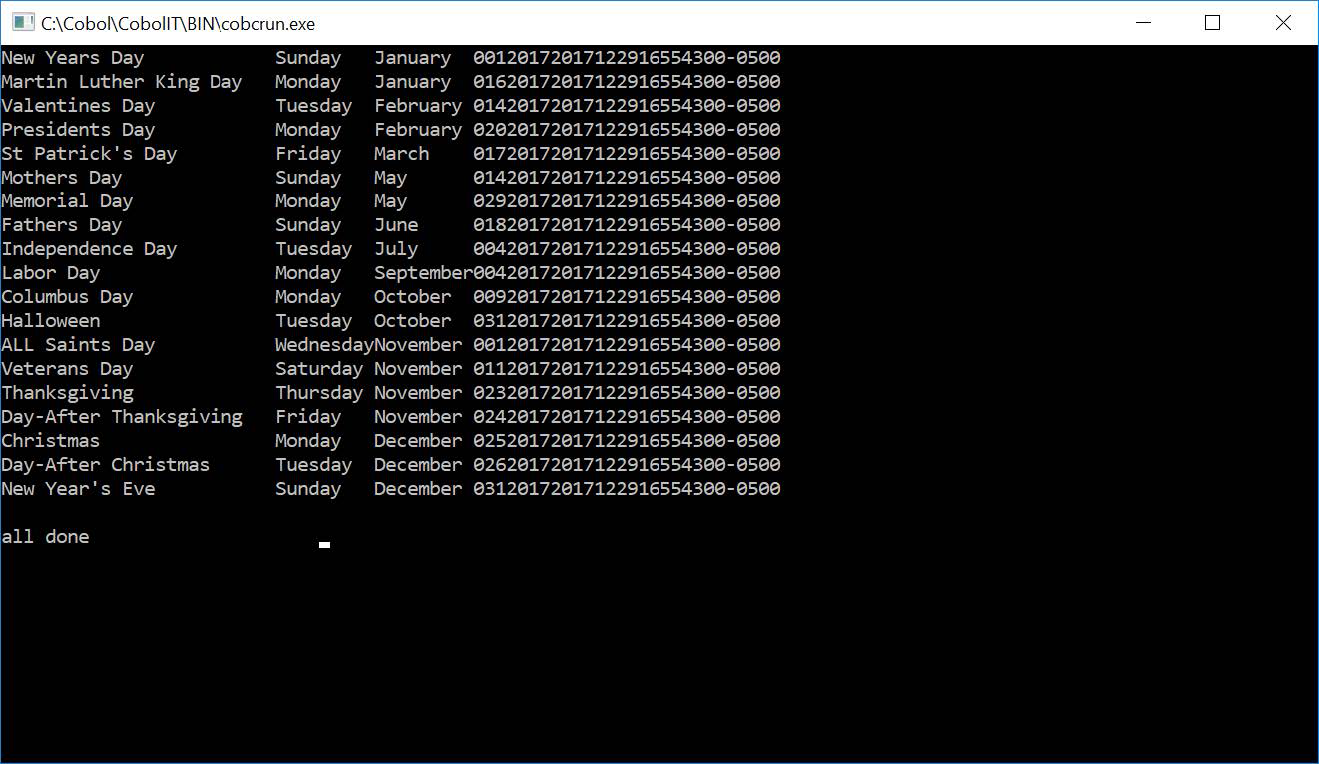
Run the program
View results
Overview
COBOL Code Coverage is based on EclEmma project. EclEmma is a free Java code coverage tool for Eclipse, available under the Eclipse Public License. The documentation is an adapted version of EclEmma User Guide.
COBOL Code Coverage records which parts of your COBOL code are executed during a particular program launch. Therefore coverage analysis always involves two steps:
- Run the program
- Analyze coverage data
Running a coverage analysis is as simple as pressing a single button like the existing Run and Debug buttons. The coverage results are automatically summarized in the Coverage view and highlighted in the COBOL editors.
Launching in Coverage Mode
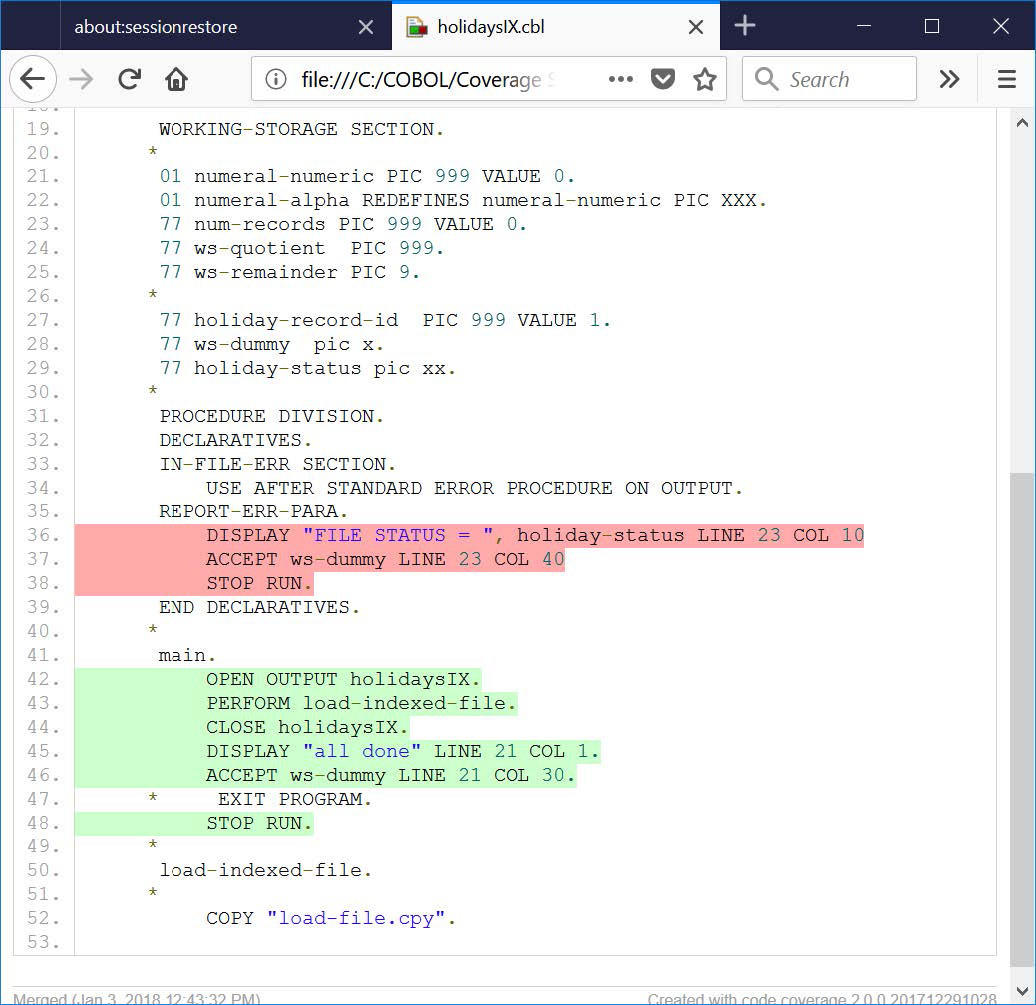
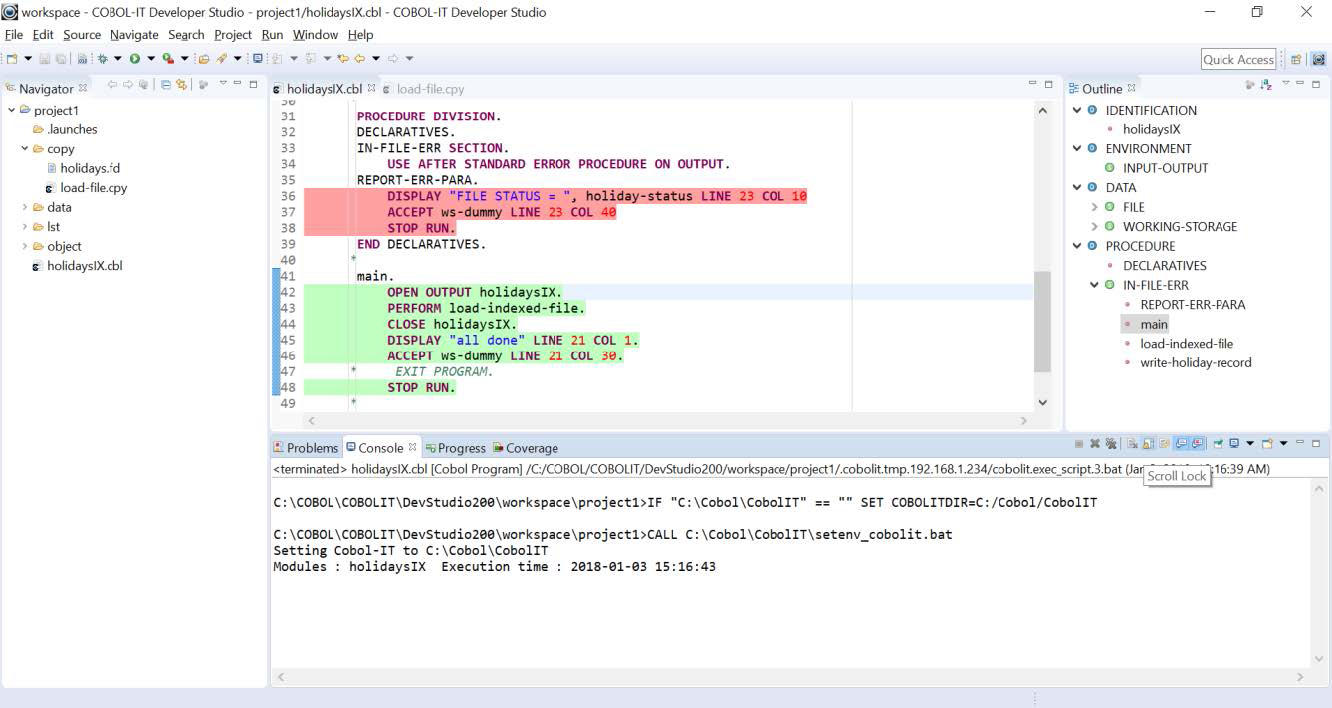
Source Code Annotations
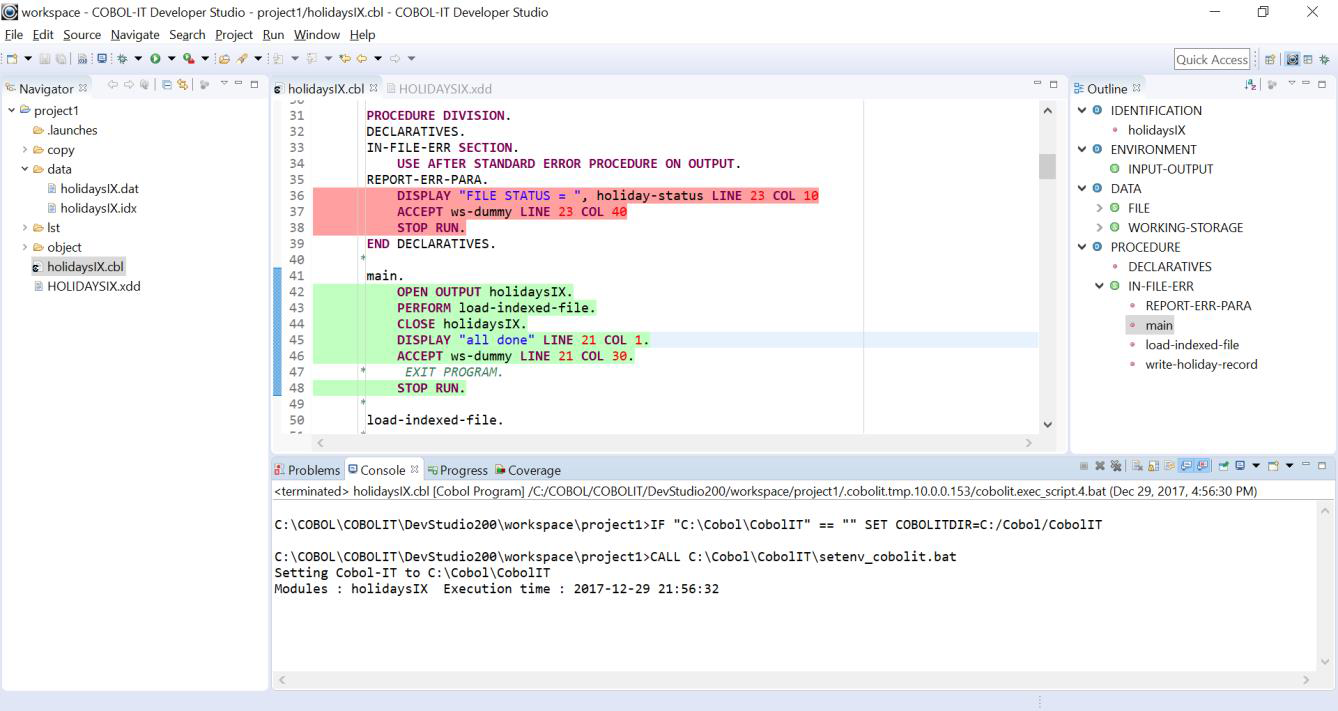
Line coverage of the active coverage session is directly displayed in the COBOL source editors.
Source lines that have been covered, and source code lines that have been missed are highlighted according to the following color code:
- green for fully covered lines
- red for lines that have not been executed
Source annotations automatically disappear when you start editing a source file or delete the coverage session.
Colors for Source annotations can be modified in the Window>Preferences dialog. To modify the color selections for Source Annotations, go to:
Window>Preferences>General>Appearance>Editors>Text Editors>Annotations.
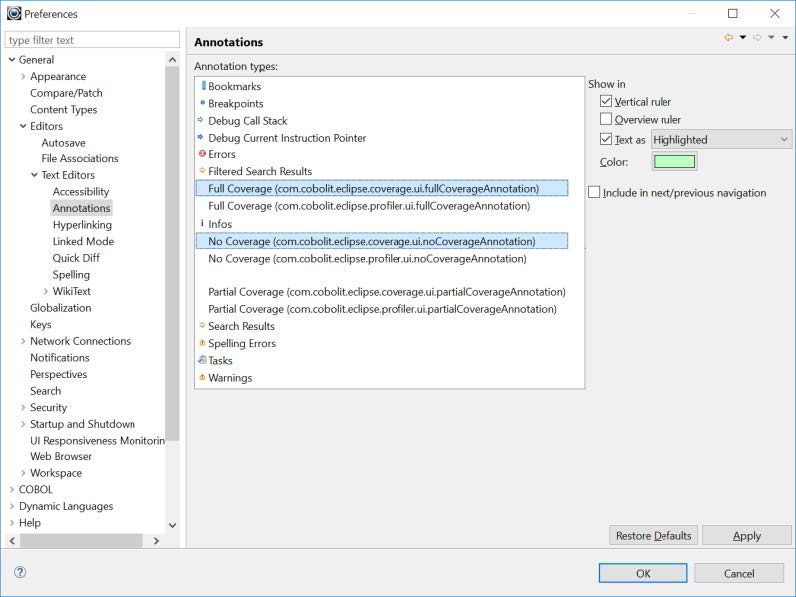
The corresponding entries are:
Full Coverage
No Coverage
Decorators
Note
Decorators are not enabled by default.
Decorators add graphical and textual information to elements shown in workbench views. COBOL Code Coverage provides coverage decorators for the source files listed in the Elements column of the Coverage View and in the Navigator Window that are being used in the currently active coverage session.
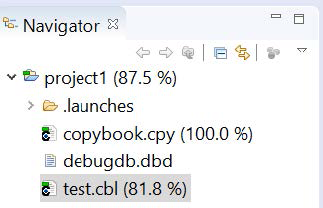
Code Coverage decorators include small green/red bars which appear next to the source files listed in the Elements column of the Coverage View, and a percentage value which appears next to the names of the source files listed in the Navigator Window.
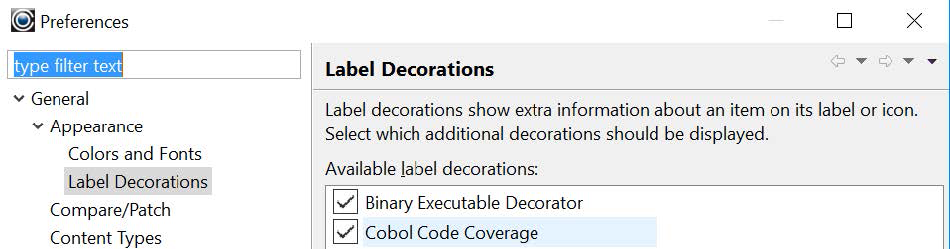
To set Decorators for the Navigator Window, go to:
Window>Preferences>General>Appearance>Label Decorations.
Select the Cobol Code Coverage checkbox.
The percentage shown is calculated based upon the covered lines. Coverage decorators are only visible if there is an active coverage session and only shown for elements containing executable code. As an example, see the image below:
The Coverage View
Opening the Coverage View
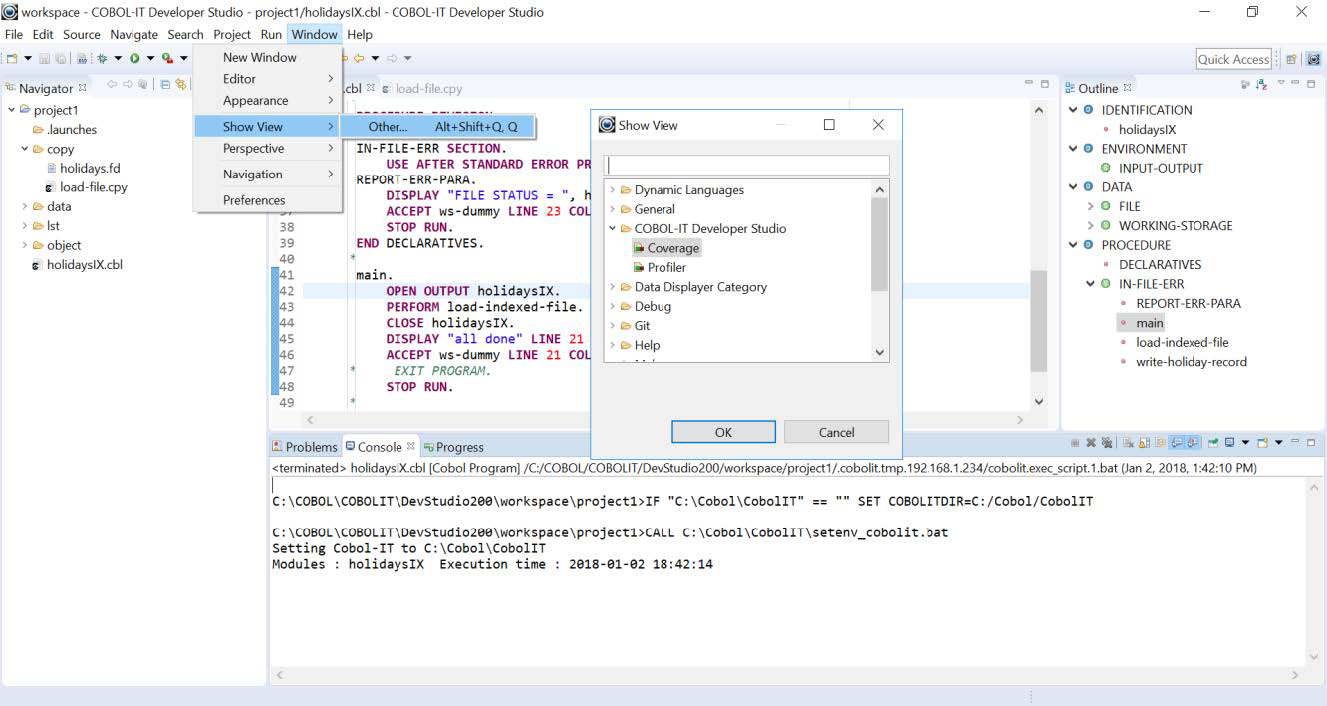
By default, the Coverage View opens when a new coverage session is added. As with other Views, it can be manually opened from the Window>Show View menu.
Coverage View Summaries
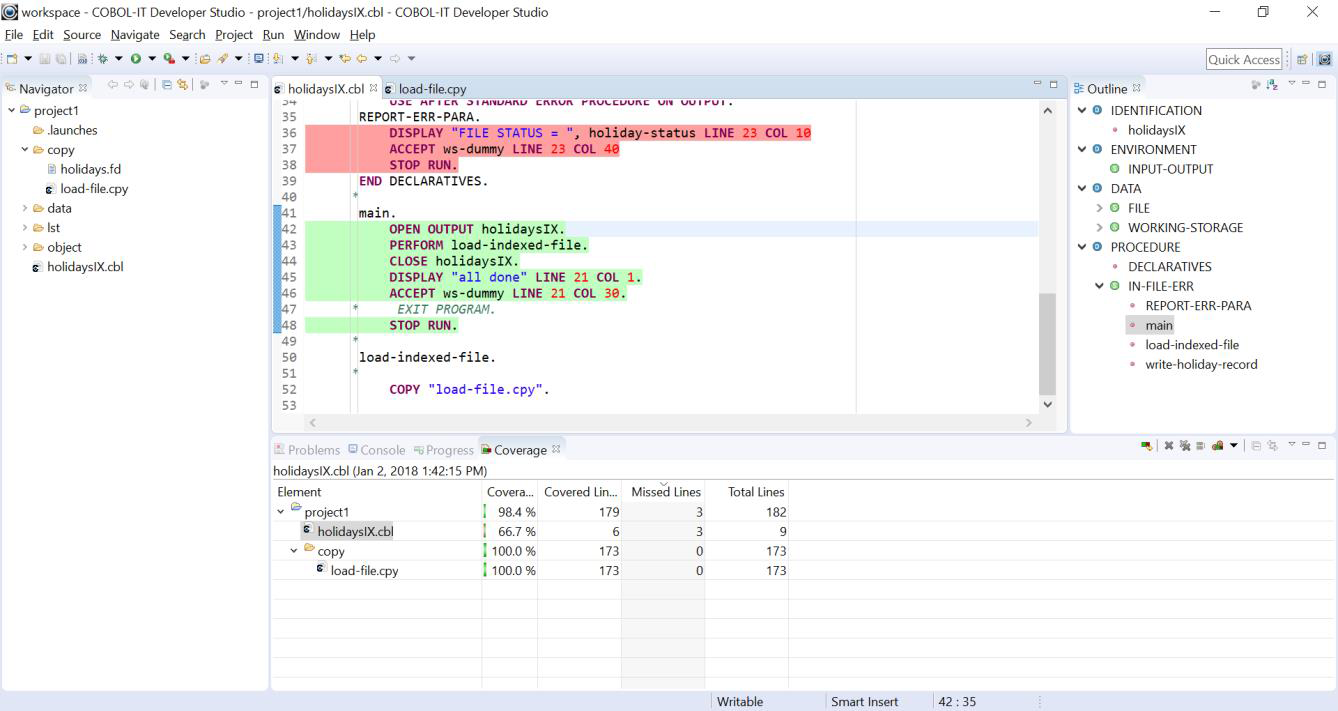
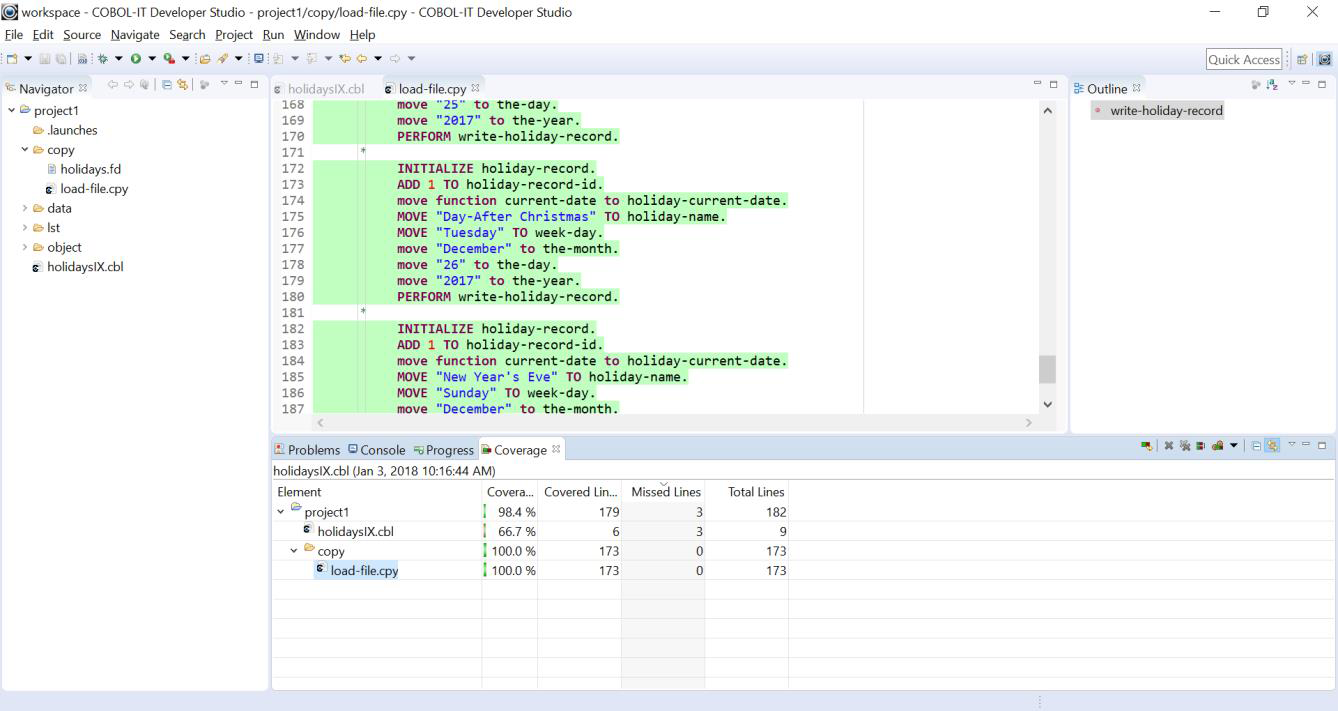
The Coverage View shows coverage summaries for the Active Session.
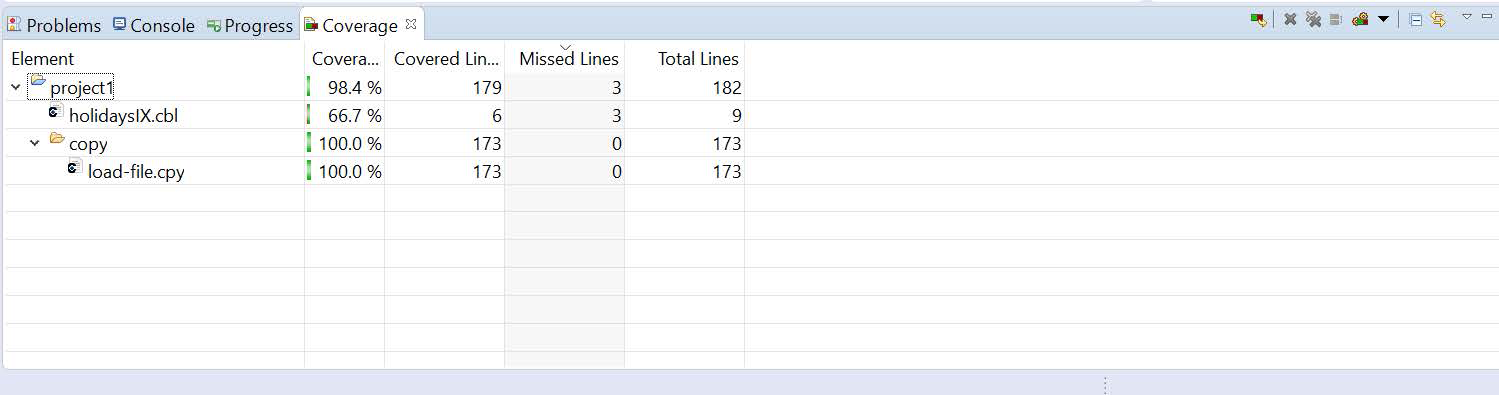
The Coverage View opens with the summary totals for the project.
Click on the dropdown arrow to the left of the project name to see the summary information displayed for each of the source files. Source files listed include copy files containing source code from within the programs that were run.
In the Coverage View, you will find the following columns:
| Column | Displays |
|---|---|
| Element | Name of Source file. Clicking on the source file in the Element column opens the file in the Editor, which will contain highlighted source code, where Covered Lines and Misses Lines are highlighted in different colors. Default colorizations for the highlights are green to highlight covered lines and red to highlight missed lines. |
| Coverage | Reports % of lines covered. |
| Covered line | Count of the lines executed in the source file. |
| Missed lines | Count of the lines not executed in the source file. |
| Total Lines | Sum of Covered Lines and Missed Lines. |
The elements may be sorted in ascending or descending order by clicking the respective column header.
The Coverage View Toolbar
The Coverage View Toolbar:
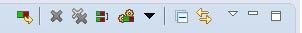
The Coverage View Toolbar contains the following functions:
| Toolbar Icon | Name | Function |
|---|---|---|
| Relaunch Coverage Session | Re-run the currently selected coverage session. | |
| Remove Active Session | Remove the currently selected coverage session. | |
| Remove All Sessions | Remove all coverage sessions. | |
| Merge Sessions | Merges multiple sessions into a single session. | |
| Select Active Session | Select session from the drop down-menu and make it the active session. Each active session includes the cumulative results of tests in that session. | |
| Collapse All | Collapse all expanded tree nodes. In a collapsed tree node, only the project-level statistics are visible. | |
| Link with Current Selection | Causes the coverage view element selected to reveal the COBOL source currently selected in other views or editors. As an example, when Link with Current Selection is selected, you can click on hello.cbl in the Element list to open hello.cbl in the Code Editor. |
|
| Show Menu | Allows selection of Hide Unused Elements. | |
| Minimize | Minimizes the Coverage View. | |
| Maximize | Maximizes the Coverage View. |
Managing Coverage Sessions
A coverage session is the code coverage information of particular program run. It contains the list of COBOL Elements, with the coverage information recorded for each.
Session Lifecycle
A coverage session is automatically created at the end of each coverage launch. Alternatively, sessions can be imported from external launches. The coverage view allows removing sessions.
All coverage sessions are deleted when the workbench is closed.
Relaunch Coverage Session
The Relaunch Coverage Session toolbar button causes the application to be re-launched. When the application session has completed the Coverage results will be displayed as the new Active Session.
Link with Current Selection
The Link with Current Selection toolbar button opens the selected source file in the Code Editor window.
The Active Session
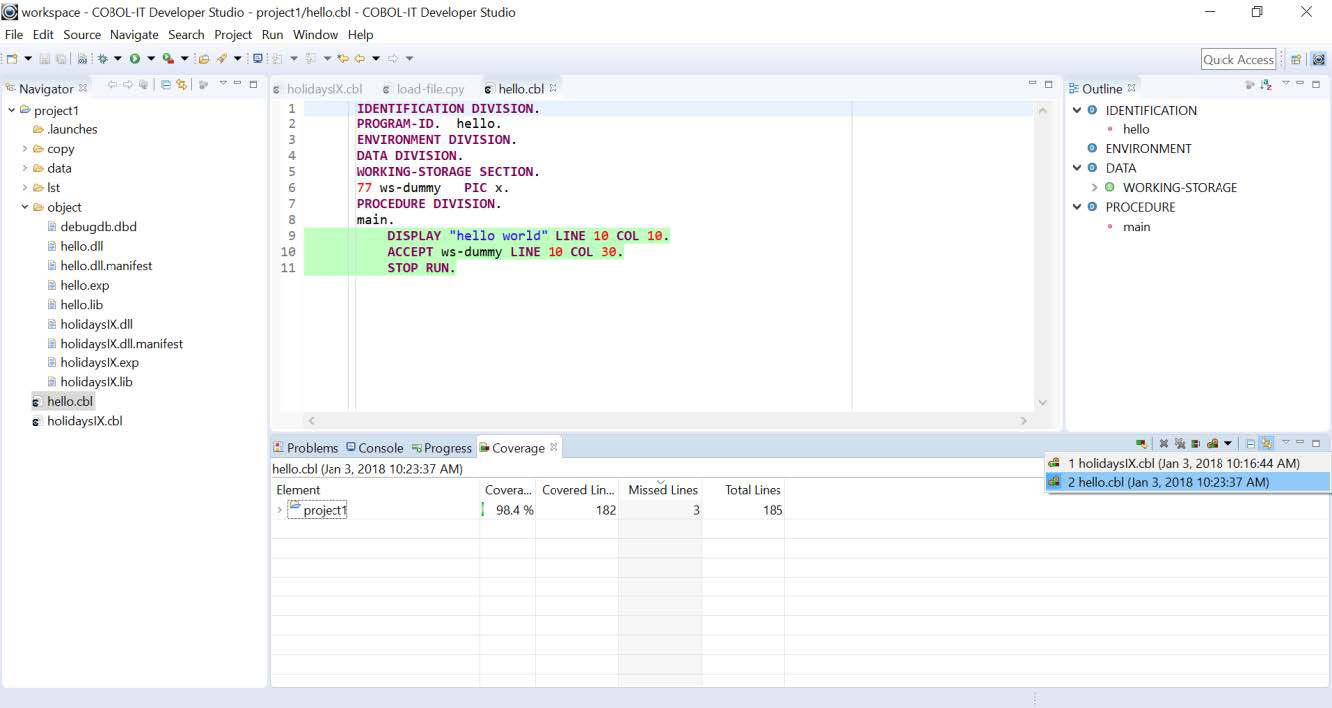
Even if there can be multiple coverage sessions, only one session can be the active coverage session. The active session can be selected from a drop-down list in the Coverage view and defines the input of this view as well as the COBOL source highlighting.
Select Active Session
The Active Session dropdown box displays the currently active session and sessions which can be selected as the Active Session. The selected session is displayed in the Coverage View.
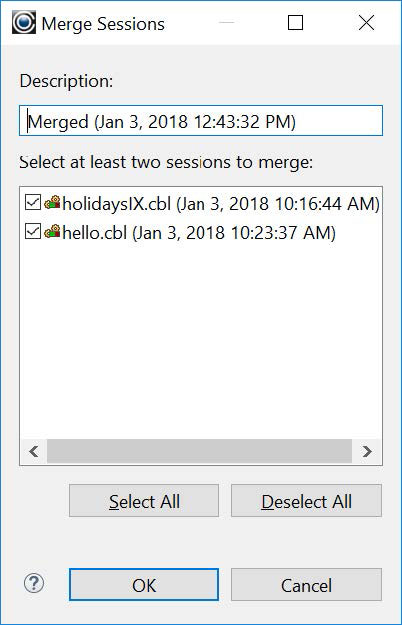
Merging Sessions
If the overall test set consists of multiple test launches, they will result in multiple different coverage sessions. For analysis it may make sense to combine these sessions to a single session. If there is more than one session the coverage view provides the Merge Sessions command. This command allows selecting a subset from the existing sessions and combining it to a single coverage session.
Session Import and Export
COBOL Code Coverage provides import and export functionality.
Coverage Session Import
If your program is launched outside the COBOL-IT Developer Studio, you might import execution data from these launches. This data could then be merged with data captured in sessions in the Developer Studio. This allows to study the coverage results directly in your source code. The Coverage Session import wizard can be activated from the File>Import... menu or from the Coverage view's context menu.
The wizard dialog requires you to specify the source of the execution data on its first page. On the second page you can specify session name and the scope, which are the projects with COBOL sources that should be considered.
Warning
Imported execution data must be based on the exact same COBOL source files that are also used within the COBOL-IT Developer Studio. If the external launch was based on different COBOL sources coverage will be shown incorrectly.
To import a Code Coverage session, select the File>Import function from the Main Menubar. On the subsequent Import screen, select Coverage Session from among the available COBOL import wizards.
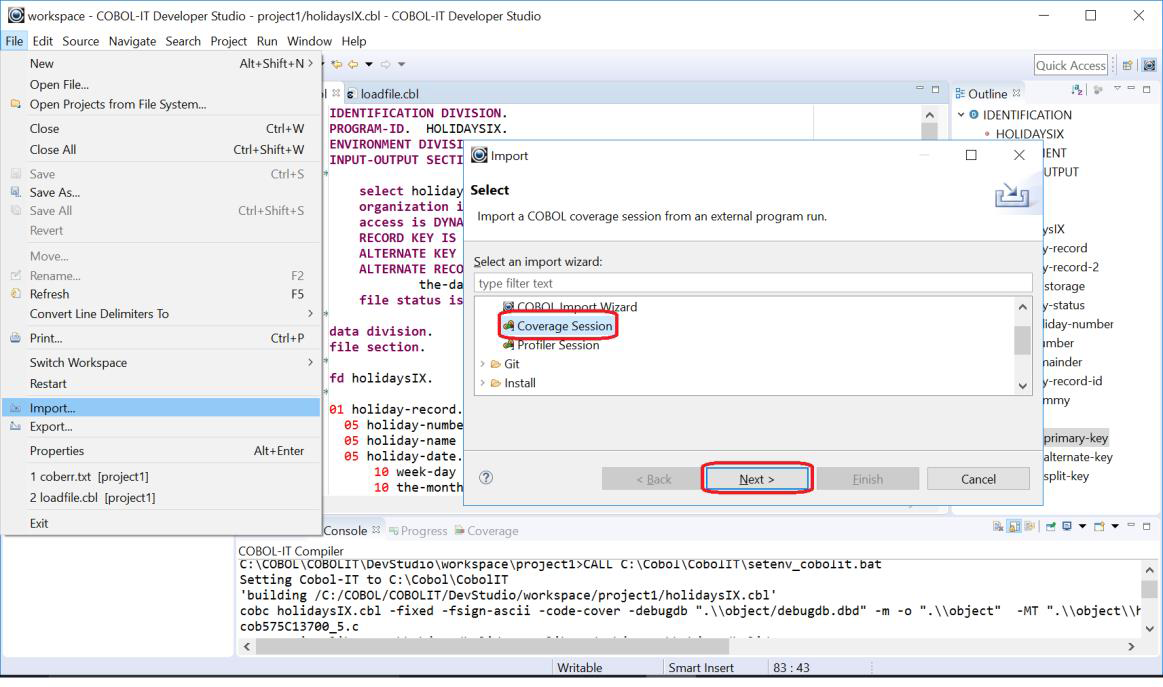
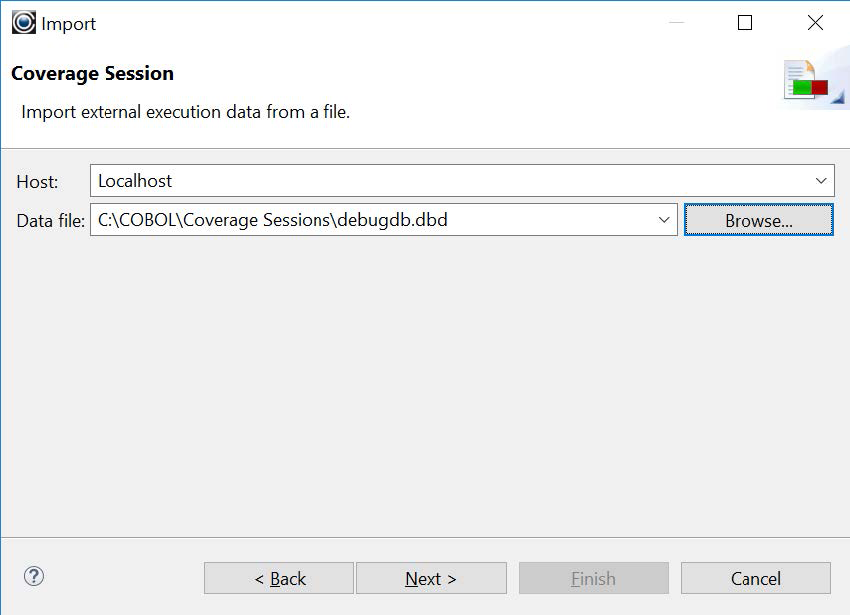
Click on the Next button to open a dialog Window, and select the Coverage Session you wish to import. Code Coverage sessions are stored in .dbd files, as described earlier. In our example below, we have used the Browse button to navigate to a .dbd file in which we have saved information.
Click Next to advance to the final screen, where you can select a specific session, or indicate the folders that are used in the project.
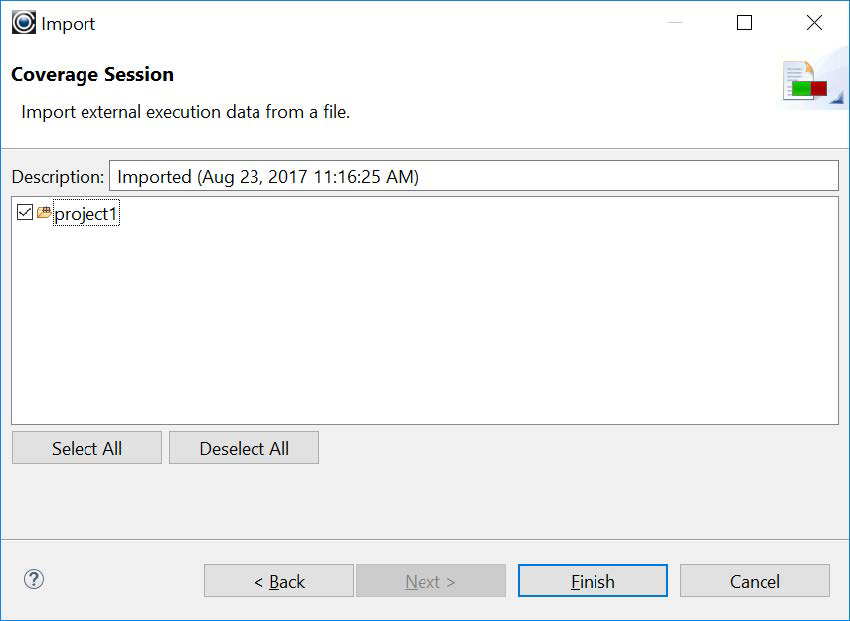
Click Finish to import the data from the Coverage Session.
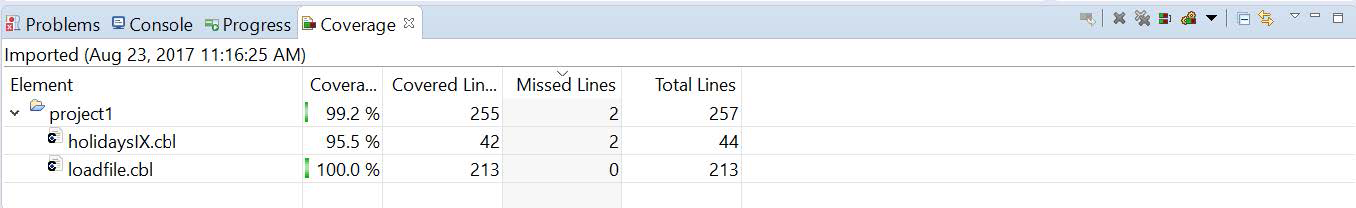
This data will be displayed in the Coverage View, with a notation that the session was imported, and when it was imported.
Coverage Session Export
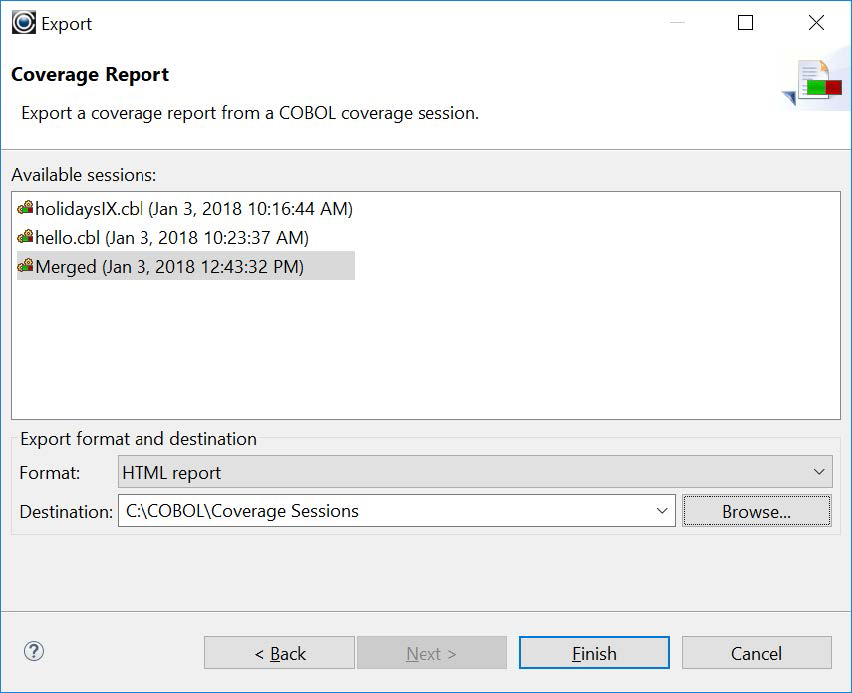
The session export wizard allows you to export coverage sessions in one of these formats:
- HTML: A detailed and browseable report as a set of HTML files.
- Zipped HTML: Same as above but zipped into a single file.
To export a Code Coverage session, select the File>Export function from the Main Menubar. There must be at least one coverage session available to use the export wizard.
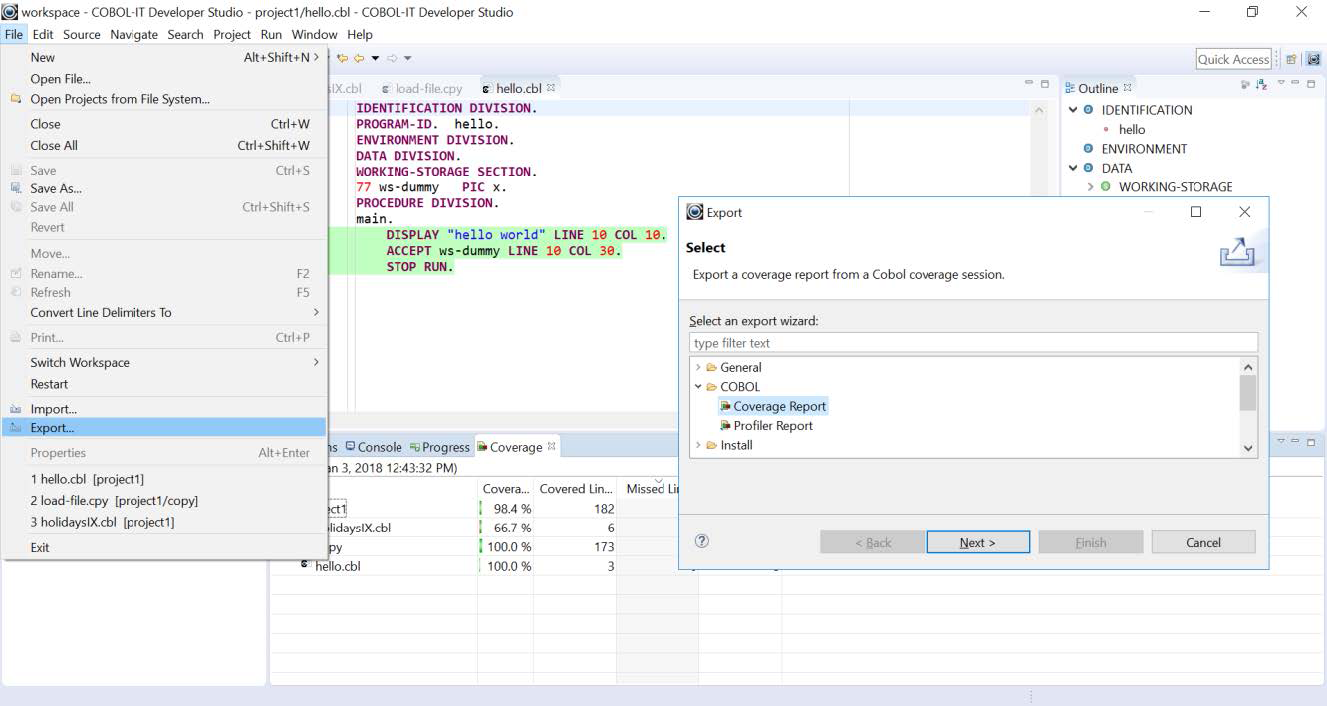
Select one of the existing sessions and the export format from the subsequent screen. Use the Browse button to select a destination folder in which to store your exported session file. Then, click on the Finish button.
Viewing your exported session
To view your exported session, navigate to the folder in which it is saved.
Click on the index.html file to open it in your browser. From your browser, you can click on the project name to expand it, and see the individual resources.
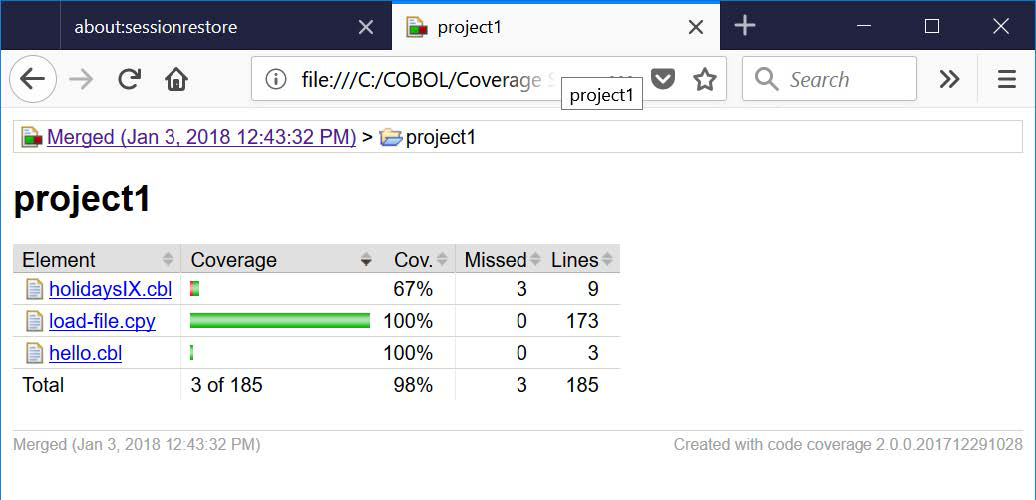
You can then click on the resource, to view the annotated source, in which covered and missing lines of code are highlighted in the green/red highlights.