Dashboard
Getting there
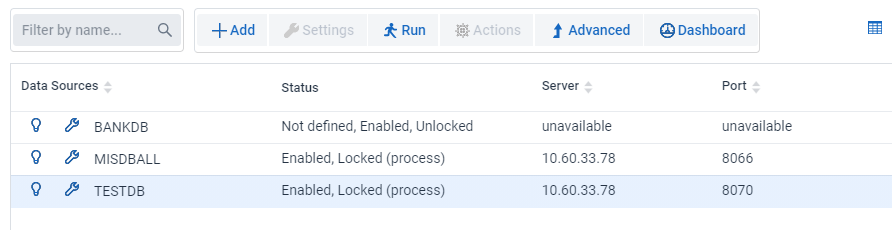
The Dashboards page is loaded when connecting to the Administrative Console. From the Client Manager's data sources page, you can click on the Dashboard button to return to the Dashboard page as seen in the screenshot below.
The Dashboard (also known as the monitor page) provides a customizable table view of status information, properties and statistics for the various Process and Clone command runs controlled by the various Client Managers. It also provides status information on the state of the Client Managers. Whenever the Client generates an alert it appears in the table as a warning icon (![]() ) to indicate that there is a problem. Select the warning icon to display the message associated with the alert. Statistics like the lag time, throughput, and the number of records processed can be viewed from the Dashboard. These customizations are global; they will be remembered on subsequent monitor screens for all users until someone changes them.
) to indicate that there is a problem. Select the warning icon to display the message associated with the alert. Statistics like the lag time, throughput, and the number of records processed can be viewed from the Dashboard. These customizations are global; they will be remembered on subsequent monitor screens for all users until someone changes them.
The Filter Columns button allows the operator to customize which items get displayed. The monitor periodically polls all active runs, which respond with a statistics record that is used to update the display. The Administrative Console in turn reads the monitor data and refreshes the screen of the consoles that are in the Dashboard page. If a Client Manager has no active runs, the monitor polls it to determine if it is alive.
If a service fails to respond to this request the monitor issues an alert informing the operator that the Client Manager is not responding. The Dashboard is the control center for Databridge operations, as you can see all the Client Managers and data source on one screen. If you need to see more, you can navigate to the console for the Client Manager in question by clicking on the link (the name or IP address of the service) at the top left corner of the group of data sources for the Client Manager.
Dashboard Columns
The Filter Columns open a dialog that allows you to select the column(s) to include in the Dashboard tables. The columns are described below; options that have an asterisk at the end are selected by default.
Run Type
The run type is process or clone.
Start time
This is the time at which the run started.
Stop time
This is the time at which the run ended, if the run is active, this column will be blank.
Lag time
The lag time is the difference between the time an update is applied to the relational database and the last timestamp encountered in the audit trail audit time stamp when the Engine processes the update (adjusted for the difference in the clocks between the two machines). Effectively, this approximates the elapsed time from when the update happened in DMSII to the time when it got applied to the relational database.
AFN/DMS*
The first part of this column is the audit file number of the audit file being processed. If the current DMSII audit file is different than the one being processed both audit file numbers are displayed with a slash between them.
ABSN*
The audit block serial number that the Engine is processing.
Audit Timestamp*
The last timestamp encountered in the audit trail.
Progress*
This column is only meaningful if the Client has fallen behind DMSII by one or more audit files. In this case it indicates approximately how far into the audit file has been processed (expressed as the percentage of blocks processed). If the client is processing the current DMSII audit file this will tend to be close to 100%.
Main Thread Status
This column displays the status of the main thread of the Client program, which is responsible for reading DMSII data. If using multi-threaded updates the DMSII data buffers get put on an update worker's work queue for processing. If not using multi-threaded updates, the main thread will be do all of the processing before reading the next DMSII buffer (this does not lead to optimum resource utilization on a modern servers that has multiple CPUs). If the main thread is waiting on something, this column will show that information.
BCP Thread status
(Window clients only) This column displays the status of the bulk loader thread of the Client program, which is responsible for launching the bulk loader and waiting for it to complete the operation. If the bulk loader thread is waiting on something, this column will show that information.
Index Thread Status
This column displays the status of the index creator thread of the Client program, which is responsible for creating indexes for tables and waiting for them to complete the operation. If the index creator thread is waiting, this column will show that information.
AF Origin
This column displays the access method for reading audit file. For Enterprise Server there are 3 possible values: direct disk, indirect disk and cache. For DBServer on the NCP this will always be host audit.
DMS Recs
This column is the count of DMSII records processed.
DB Ops Count
This column is the count of SQL updates executed. If you do not flatten OCCURS clauses this count can be significantly larger than the DMS recs count.
DB Suppressed Updates
When you use do not flatten an OCCURS clause and enable the Optimize Updates parameter redundant updates to secondary tables are suppressed. This is the number of updates that were suppressed because they would not change anything.
DB Filtered Records
When using occurs table filtering, you define filtering conditions that discard secondary table records whose values indicate that the data they contain is meaningless. For example, in an OCCURS 12 TIMES clause it is possible that only the first 3 occurrences are meaningful data. This is the count of the number of records that were filtered out.
DB Discarded Records
This is the count of the records that could not be used to update the relational database, as their key columns had bad data.
DB Error Records
This is a count of the records that had data errors, which caused some columns to be set to NULL.
Bytes Extracted
This is the count of actual DMSII data bytes that was sent to the Client.
Total Bytes Received
This is the count of bytes sent to the Client, it includes DMSII data and the protocol overhead.
BI Bytes Extracted
The client uses BI/AI pairs to process updates in some situations, including processing occurs tables when the Optimize Updates parameter is set to True, or when there is an actual key change in a DMSII record, and lastly, when processing data sets that have OCCURS DEPENDING ON clauses. This column is the number of before image bytes sent to the client.
Throughput*
Throughput is calculated by dividing the bytes received by the elapsed time. It is expressed in kilo-bytes per second.
Total throughput
Total throughput is calculated by dividing the total bytes received by the elapsed time.
Records Per Second*
This is rate at which the Client is receiving DMSII records from the Databridge server.
Updates Per Second*
This is rate at which the Client is executing SQL updates.
% Wait for TCP
This represents the percentage of time the main thread was waiting for TCP input from the server.
% Wait for DMS Buffer
This represents the percentage of time the main thread was waiting for a DMSII buffer to become available before it read DMSII data.
% Wait for WS
This represents the percentage of time the main thread was waiting for a working storage block to queue a DMSII buffer on an update thread worker's work queue. These small blocks are pre-allocated, and the Client should have a sufficient amount. DMSII buffers can be placed on multiple worker's queues, possibly multiple times, as a DMSII buffer can generate updates for many tables. To be able to do this, we use working storage blocks, which contain the links for the items on the work queue and point to the DMSII buffer.
% Wait for SQL
This represents the percentage of time the main thread was waiting for a SQL query to finish.
Wait for Transactions
This represents the percentage of time the main thread was waiting for a commit to finish.
CPU Timestamp
This represents the percentage of time the main thread was running.
Stop Run Time
This column represents the time at which the Client will stop as a result of an operator Stop command that specifies the time when the Client will stop.
Stop AFN
This column displays the last AFN that the Client will process before stopping. It is the result of an operator issuing a stop after AFN command.
Last Run Exit Code*
If the data source does not have an active run this column displays the exit code of the last run. Otherwise, the column is blank.
Next Run Time*
If the data source does not have an active run and the service's scheduling will start a run, this column represents the scheduled launch time for the run. Otherwise, the column is blank.