Debugging the Process
If you are getting a response from the server, but not the response you expected, the next step is to debug your process.
In general, a debugger is a program which lets you see every step of the program execution, stop the program while it is running, note the program variables, and start the program running again. Debuggers are an indispensable tool in the development process.
To debug a process
-
To add a breakpoint, in the BPEL Editor, right-click on an activity and, if the activity supports breakpoints, select Add Breakpoint. Breakpoints are intentional stopping or pausing places in the process and are indicated by a blue dot. They are not supported by every BPEL activity.
-
Click
 to deploy the process using the debug deployment option. This launches the Web Services Explorer where you can initiate the process.
The debug deployment differs from the standard server deployment.
-
Using the step icon
 on the debug toolbar, step through the process. There are visual indicators of where the process is at any given time.
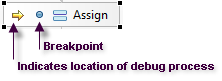
The Debug view has two tabs - the Breakpoints tab which shows you the breakpoints you have set and the Variables tab which shows you the value of the variables as you step through the process. On this tab you can see the value of the variables changing as you walk through the process and determine if the values are what you expect. There are multiple ways to view this valuable information; as a tooltip-type window, in the lower status section of the Debug view, and probably most efficiently, the Variable window available from the toolbar
 .
. -
Step through the program. At each breakpoint the program pauses so you can track your variables on the tab, note any problems, and then resume the process. It may take a few moments for each step to complete. Stepping through certain activites, like an Invoke, may involve a call to the service running external to the process. The Resume icon
 stops the process only at breakpoints, while Step walks you through each part of the process.
How do I correct an error?
To correct errors discovered while debugging the process, exit debug mode and edit the variables in the usual manner. You can then re-test your process.
Warning
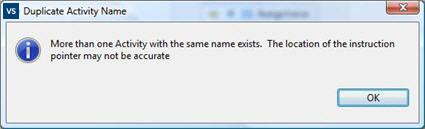
In order for the debug process to work effectively, you must assign a unique name for each BPEL activity in your process. Otherwise the debugger cannot distinguish between breakpoints and selected activities and you cannot rely on its location. If this situation occurs you will see this warning:
More information